EUR/USD analysis for April 19, 2021
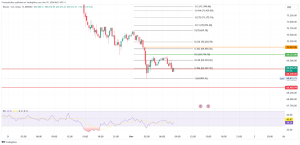
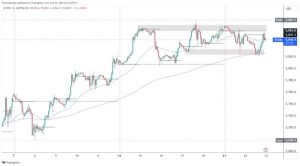
The chart on the four-hour time frame shows that the pullback reached up to 61.8% Fibonacci levels at 1.20366. We had it in the 61.8% -78.6% Fibonacci level zone if we look at the previous pullback. We can expect the same at this level now. Bounce down the water us to 50.0% Fibonacci level at 1.19720 where moving averages MA20 and EMA20 with momentum with the help of MA50 are waiting for us. A break above this level leads us to the previous high at 1.21000, close to the next resistance at 78.6% level. The MACD indicator is on the bullish side, again crossing over the signal line, although we need better confirmation if we want to climb higher on the chart.
On the daily time frame, we see that after a brief consolidation around MA50, the EUR/USD pair made a break above with a target on the top line of this declining consolidation. Following the Fibonacci level, the EUR/USD pair bounced exactly at 23.6% level, which is a sign of a strong bulls trend, which we can expect in the coming period. Our next technical target is 1.21000 on the top channel line. The MACD indicator is in a bullish trend from the previous low to 1.16980 at a Fibonacci level of 38.2%, and based on it; we will continue to be in a bullish trend.
We see that the EUR/USD pair is testing moving averages of MA20 and EMA20 at 1.20350 as part of this downward consolidation on the weekly chart. The break above them will give us a clearer picture of the potential continuation of bullish trends, with a new look at the previous high at 1.23550. If the Euro slows down and runs out of power, we will see a pull-down, probably first to the moving average of the MA50 and the lower trend line seeking support for a new potential bullish boost. According to the MACD indicator, we get out of the shorter bearish trend by switching to bullish, pushing the EUR/USD pair to higher levels on the chart.


