NZD/USD analysis for May 6, 2021
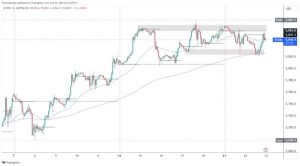
Looking at the graph on the four-hour time frame, we see that after reaching the previous high at 0.74645, there was a drop to 0.69430. Then we have a pullback that matches the 61.8% Fibonacci level at 0.72643. after that, again, a shorter withdrawal to 38.2% Fibonacci level at 0.71000. We have a continuation of the bullish trend again because the NZD/USD pair found support on the moving average MA200 and EMA200; in the meantime, we got support with other moving averages by crossing 50.0% Fibonacci levels. We are now looking again at a 61.8% Fibonacci level expecting a break above to further continue to the previous high.
Otherwise, if we see the weakening of the New Zealand dollar, we must pay attention to the lower support line and 38.2% Fibonacci level to 0.71000-0.71400. With a break below that, we are looking for support at 23.6% Fibonacci level at 0.70644, the place of the previous break of the bullish trend. Looking at the MACD indicator, we see that we are in the bullish option in the short next period, although the last three histograms are of lower bullish intensity.
From the economic news for the NZD/USD currency pair, we can single out the following:
The total number of building permits issued in New Zealand increased seasonally adjusted by 17.9 percent in March, New Zealand statistics announced on Thursday – 4,218. This is due to a monthly contraction of 19.3 percent in February. The increased number of new homes approved in recent years is mainly due to an increase in consent for higher-density homes, such as townhouses.
The number of detached houses compliant during this period is relatively flat, “Construction Statistics Manager Michael Heslop said. In the year to March, building permits climbed 9.1 percent. From the U.S. market, we will have important news later Initial Jobless Claims and tonight’s statements and forecasts of Fed members.


