EURUSD and EURJPY daily chart analysis for Aug 24, 2021
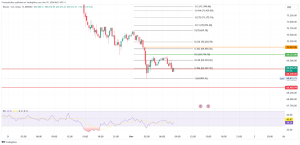
Looking at the EURUSD chart on the daily time frame, we see that the pair is consolidating around 1.17400 today. This week the Euro has advanced positively compared to the previous week. We can expect that by the end of this week, the EURUSD will continue to approach the 20-day moving average and the 50-day moving average in the zone around 1.18000. We need resistance in moving averages and negative consolidation for the bearish scenario, which would again direct EURUSD towards lower levels and re-testing the 38.2% Fibonacci level at 1.16950. If the pair manages to overcome that resistance, then we can see the pair approaching 23.6% Fibonacci level at 1.19450.
EURJPY chart analysis
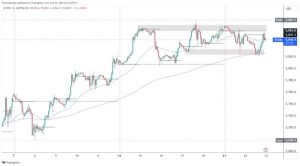
Looking at the EURJPY chart on the daily time frame, we see that the pair found support at 50.0% Fibonacci level at 127,800. Still, now the obstacle for us to continue the bullish trend is the 200-day moving average, which coincides with the 38.2% Fibonacci level at 1.29,285. Only a break above that resistance zone can bring us back to the bullish trend, while otherwise, we descend again to the bottom line of this channel and 50.0% Fibonacci level.
Market overview
The rise in price pressures in the eurozone this year is considered temporary, said the member of the executive board of the European Central Bank (ECB), Isabel Schnabel, summarizing a weekly interview with a German magazine in a Twitter storm on Tuesday.
“The ECB is not concerned about the current high inflation rates, which it estimates will fall significantly from next year.”
“The current high inflation rates do not mean that monetary policy will soon be tightened.”
Germany’s economy grew faster than expected in the second quarter, driven by domestic demand, after shrinking in the first three months of this year, the latest Destatis data showed on Tuesday.
The gross domestic product grew by 1.6 percent seasonally and calendar-adjusted compared to the first quarter when production fell by 2.0 percent. An increase of 1.5 percent was initially estimated.
In the second quarter of 2020, GDP fell by 10 percent amid the peak of the Covid-19 pandemic.
Destatis said that economic production is still 3.3 percent lower compared to the fourth quarter of 2019, the quarter before the beginning of the coronavirus crisis.
On an annual basis, GDP grew 9.8 percent in the second quarter, after falling 3.3 percent in the first quarter. Growth is estimated at 9.2 percent as estimated.
As the lock-in restrictions associated with the coronavirus pandemic were eased, consumption grew.
Private spending rose 3.2 percent from the first quarter, and government spending was 1.8 percent.
Investments in machinery and equipment, as well as in construction, increased by 0.3 percent.
Exports rose 0.5 percent and imports 2.1 percent.
The recovery of the German economy has been weaker than in many other eurozone countries as the manufacturing sector has suffered from supply chain problems,” said ING economist Carsten Brzeski.
Three factors will determine the outlook for the German economy: the Delta variant, supply chain friction, and inflation,” the economist added.
ING still expects the German economy to return to pre-crisis levels by the end of the year.
The total volume of retail in New Zealand increased seasonally in the second quarter of 2021, by 3.3 percent compared to the quarter, New Zealand statistics announced on Tuesday – accelerating from 2.8 percent in the previous three months.
The total retail value rose 4.0 percent quarterly (NZ $ 1.1 billion).
Year on year, retail sales rose 33.3 percent after rising 6.6 percent in the previous three months.


