EURUSD, GBPUSD looking for new supports on the chart
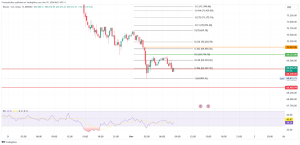
Today, the picture is totally different after yesterday’s rise above moving averages and consolidation above 23.6% Fibonacci levels. The EURUSD pair has slipped below due to a stronger dollar at the current 1.17650. We are now under pressure from moving averages from the top and expect a further descent to the previous low at 1.16640. For the bullish scenario, we need positive consolidation and a new jump above 23.6% Fibonacci levels to 1.18000. Our next target is the previous high at 38.2% Fibonacci level at 1.18940. If the EURUSD price rises above that resistance by any chance, our next target is 50.0% Fibonacci level at 1.19650, where we can expect higher resistance because we are approaching the 200-day starting average.
 GBPUSD chart analysis
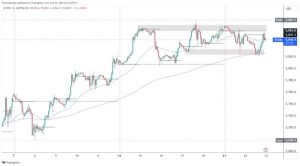
Looking at the chart on the daily time frame, we see that we have been moving sideways around the 200-day moving average for a week now, but with the support of the 20-day and 50-day moving average. We can also say that the GBPUSD price for the same time tests 38.2% Fibonacci level at 1.38300. To continue on the bullish side, we need a stronger break above and testing the next 50.0% Fibonacci level at 1.39000. The opposite scenario is on the bearish side, and for that, we need a negative consolidation that will direct the pair towards a 23.6% Fibonacci level at 1.37320. A break below that level leads us to new testing of pre-hog lows in the 1.36000 zone.
Market overview
The trade surplus in the eurozone increased in July for larger deliveries, the first estimate of Eurostat revealed on Thursday.
The trade surplus increased to seasonally adjusted EUR 13.4 billion from EUR 11.9 billion in June.
Exports increased by 1 percent per month, while imports increased by only 0.3 percent.
On an unadjusted basis, exports of goods recorded an annual growth of 11.4 percent, and imports 17.1 percent. The result is the trade balance showed a surplus of 20.7 billion euros, compared to 26.8 billion euros in the same period last year.
Exports increased by 14.8 percent from January to July, and imports by 15.5 percent compared to last year. Consequently, the trade surplus was € 122.4 billion versus € 112.8 billion from January to July 2020.
Inflation in France rose in August, according to initial estimates, to the highest level since the end of 2018, the latest INSEE figures showed on Wednesday.
The consumer price index rose 1.9 percent from last year after rising 1.2 percent in the previous month.
Annual inflation was the highest since November 2018, when it amounted to 1.9 percent. In October of that year, inflation was 2.2 percent.
Core inflation accelerated sharply from 0.4 percent to 1.5 percent.
Compared to the previous months, consumer prices rose 0.6 percent in August, after a rise of 0.1 percent in the latest month.
The Australian economy reported less 146300 jobs, the Australian Bureau of Statistics announced on Thursday.
That was far from the forecast for the loss of 90,000 jobs after adding 2,200 jobs in July.
Last month, 68,000 full-time jobs were lost, while 78,200 part-time jobs were lost.
The unemployment rate somehow fell to a seasonally adjusted 4.5 percent compared to forecasts by 4.9 percent and from 4.6 percent in the previous month.
The participation rate slipped to 65.2 percent, missing forecasts by 65.7 percent, and fell from 66.0 percent a month earlier.

 GBPUSD chart analysis

