EURUSD, GBPUSD Forecast: a chance for a short recovery
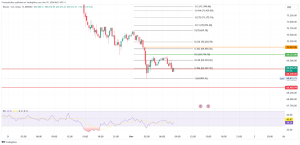
Looking at the EURUSD chart on the daily time frame, we see that the pair is stable today at 1.15580. We need a more concrete move on the chart to determine further movement towards new lower levels or pullback towards the previous break zone and moving averages. More broadly, we are still in a downward channel, and the pressure on EURUSD is still in effect. Today is the first day of the month, and we can expect a few days of consolidation before a stronger momentum on the chart.
To continue on the bullish side, we need positive consolidation and growth above 1.16000 in order to achieve stronger support and move from the psychological level to 1.15000. After moving above 1.16000, we look at the next resistance at 1.16500, the breaking point, and the previous low from the month of August. While 50 pips above us are waiting for 20-day and 50-day moving averages as the next stronger resistance and transition to a more concrete bullish trend. In the bearish scenario, we need a negative consolidation that will bring us down to 1.15000. Under stronger bearish pressure, the pair can easily slip to lower levels, seeking the next potential support.
GBPUSD chart analysis
Looking at the GBPUSD chart on the daily time frame, we see that the pair found support at 1.34000 yesterday, and today we have a continuation to the bullish side and growth to the current 1.35250. If this short bullish momentum continues, we can expect to test the first resistance soon at 1.36000, a zone that has been our support for the last three months. The next resistance above is our moving averages in the area around 1.37000 and the upper falling trend line. For the bearish scenario, we need a decline from the zone to 1.36000 with negative consolidation and another descent and testing of this year’s low to 1.34000.
 Market overview
Production activity in the eurozone continued to decline in September as supply-side constraints reduced production, the results of today’s IHS Market survey showed.
The final Index of manufacturing procurement managers fell to 58.6 in September from 61.4 in August. It was the lowest level since February, and the Index recorded the biggest drop since April 2020.
New orders and production signaled considerable moderation in growth. New export orders have been growing at the slowest pace since January.
Supply constraints were a key obstacle to production schedules. Looser demand conditions were also another contributing factor, and stock delivery deadlines continued to extend in September.
As for prices, the research revealed that inflationary pressures in September are still current. To protect profit margins, producers have raised their output prices at a faster rate than seen in August.
Germany recorded the most significant slowdown compared to August due to supply shortfalls. The IHS Markit / BME final PMI production title in September fell to an eight-month low of 58.4, from 62.6 in August, and the forecast was 58.5.
In September, the growth of production activities in France also slowed down as delivery delays and price jumps burdened production and new orders. The final factory PMI fell to 55.0 from 57.5 in August, and the forecast was 55.2.
Production growth in Italy remained strong in September. Still, the growth rate was the slowest since February. The factory PMI fell to 59.7 from 60.9 in August.
Spain’s manufacturing sector continued to grow at a slower pace in September. The factory PMI fell to 58.1 from 59.5 in the previous month, and the forecast was at 58.2.


 Market overview
