EURUSD, GBPUSD, NZDUSD Daily View of Chart Movement
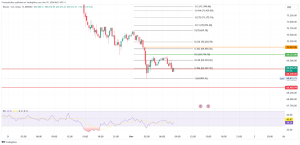
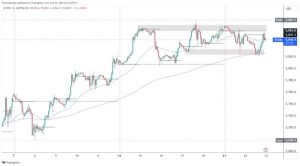
Looking at the EURUSD chart on the daily time frame, we see that the pair is consolidating around 1.15500. A little more pressure, and here we are in the 1.15000 psychological support zone. In the second half of the year, we are in a bearish trend that has formed a certain downward channel on the chart. As long as we are in this channel, we can expect a further decline of EURUSD to new lower levels. We need a positive consolidation for the bullish trend that would raise us to the previous resistance zone 1.16500-1.17000 and the upper channel line. For further continuation, we need a break above this zone, and after that, our next resistance is our previous high at 1.19000 from the beginning of September.
GBPUSD chart analysis
Looking at the GBPUSD chart on the daily time frame, we see that the pair is still in consolidation at 23.6% Fibonacci level. For the bullish scenario, we need a break above the 20-day moving average. Then we can expect growth to the next resistance at 38.2% Fibonacci level at 1,37300. Additional resistance at that level is in our 50-day moving average. For the bearish scenario with negative consolidation, we go further down with the goal of revisiting the previous low at 1.34100. Before that, we will probably test the psychological level at 1.35000.
NZDUSD chart analysis
Looking at the NZDUSD chart on the daily time frame, we see that we have been in bullish consolidation for the last week and can expect a further continuation towards the next upper resistance. We will soon come across a 20-day moving average at 38.2% Fibonacci level. Moreover, we need a break above to continue towards larger resistance zones. The target on this time frame is our upper trend line in the zone 61.8% -78.6% Fibonacci level 0.70500-0.71000. We need a negative consolidation for the bearish scenario that will steer the pair towards the previous low at 0.68500 and test the lower trend line of support.
Market overview
Wholesale price inflation in Germany has accelerated the fastest since 1974, Destatis data showed on Tuesday. Wholesale prices rose 13.2 percent year-on-year in September, after increasing 12.3 percent in August. Destatis said the last time there was a more considerable increase than in the same month the previous year was in June 1974, when wholesale prices rose 13.3 percent after the first oil crisis. The latest annual growth is primarily caused by a sharp increase in many raw materials and semi-finished products.
Germany’s economic confidence has fallen for the fifth month in a row. It reached its lowest level since March 2020 due to supply shortfalls and higher import prices. The study results by the Leibniz Center for European Economic Research (ZEV) showed on Tuesday.
ZEV’s economic sentiment index fell to 22.3 in October from 26.5 in September. The reading was under the economists’ forecast of 24.0 and was the lowest since March 2020, when the result was -49.5.
Payroll employment in the UK, as well as job vacancies, reached record levels at the end of the third quarter as the economy recovered from the downturn due to the pandemic.
In the three months to August, the employment rate rose by 0.5 percentage points in the quarter, to 75.3 percent. The ILO’s unemployment rate reached 4.5 percent in the three months to August, as economists expected. The rate fell from 4.6 percent in the three months to July.


