
Diamond Pattern Trading Explained
A diamond top formation represents a part of a technical analysis that occurs at market tops. It can signal a reversal in an uptrend. Diamond pattern trading is not so common among technical traders today. It’s an advanced form of trading that occurs on many financial markets, and in this article, we dive into its specifics.
Diamond pattern trading definition – Understanding diamond patterns
A diamond pattern is an advanced chart formation that occurs in financial markets and is used to detect reversals. It is one of the trading strategies for profitable reversal patterns.
Its appearance most often occurs after a prolonged trend phase. Therefore, when it occurs in the context of a bullish market, it is referred to as a diamond top or a bearish diamond pattern.
Also, if it occurs in the context of a bearish market, it is referred to as a diamond bottom or a bullish diamond trading pattern. A diamond as a trend reversal chart pattern is composed of two triangles, symmetrical, which follow each other. The rhombus shape of these two juxtaposed triangles gives the diamond name to this figure.
Diamond Tops and Bottoms Reversal Signals – Key Characteristics
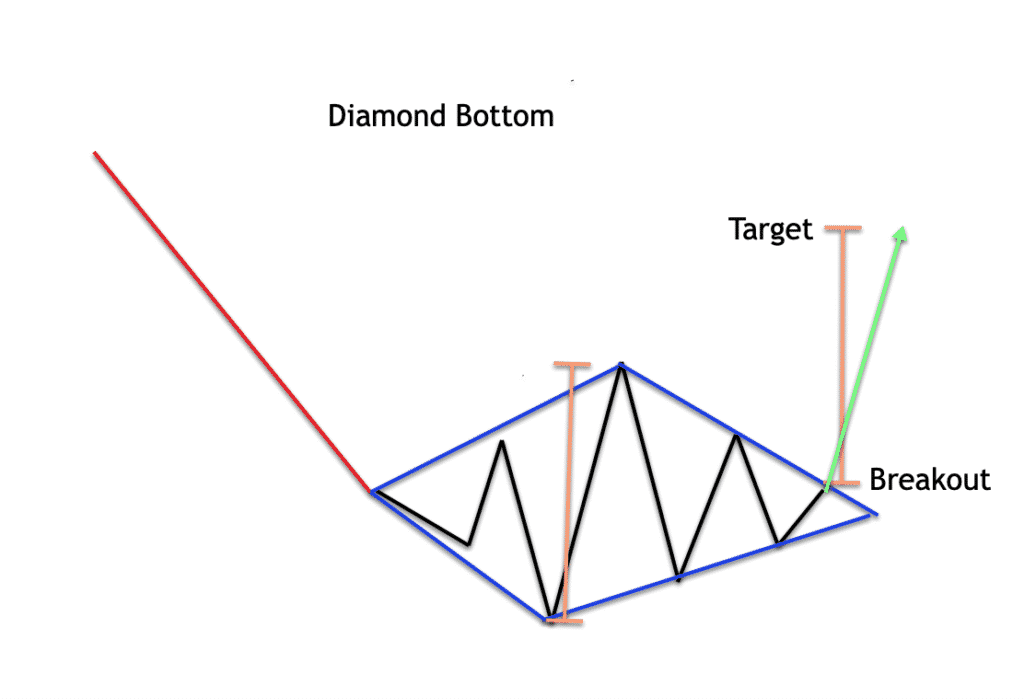
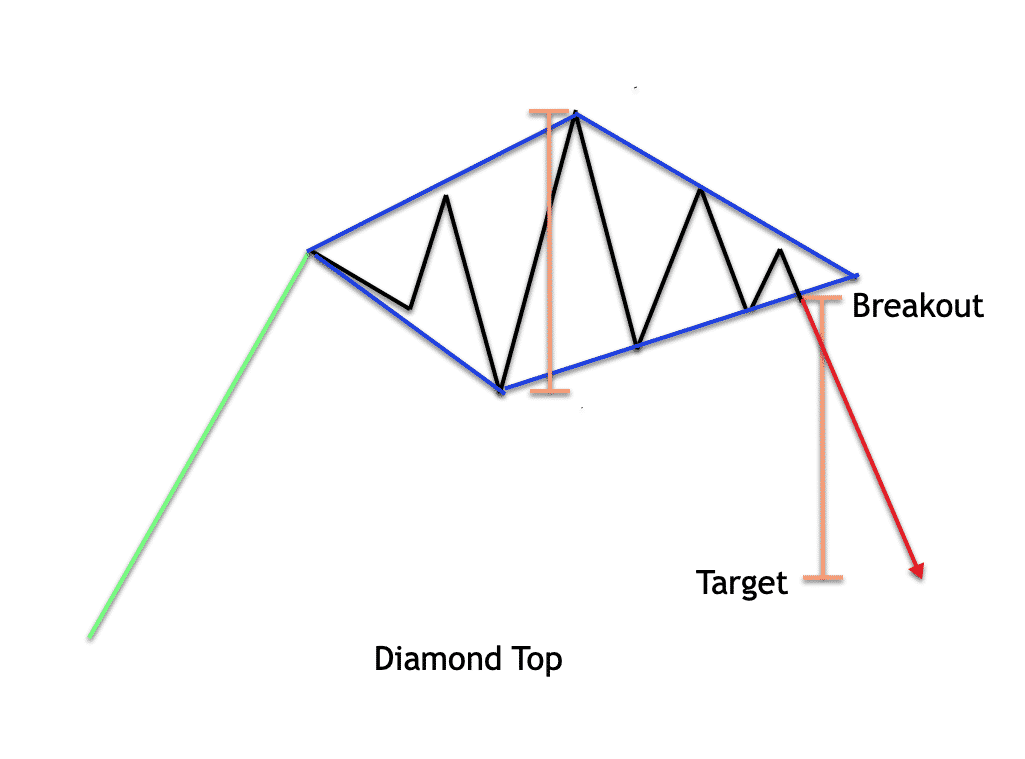
First of all, there are two types of diamonds: diamond tops and bottoms. Diamond tops represent about 80% of cases and announce a price drop.
Diamond bottoms represent only 20% of cases but announce a sharp rise in prices at the exit of the pattern.
Diamonds tops are recognized according to the following criteria:
- An uptrend precedes them
- Significant volatility between resistance and a floor
- The formation of two symmetrical triangles
Diamond bottom patterns are recognized similarly, except that a downtrend precedes them.
Like many trading patterns, diamonds are difficult to spot before they come true. However, the extensive use of chartism by the trading community gives it a certain power of self-realization. It is, therefore, necessary today to take into account the appearance of a figure such as a diamond in trading.
Often most diamond chart reversals occur at major highs and with high volume, rarely at market lows. You may notice diamond lows in a bull market with an upside breakout, while for overall performance, those in a bear market always come second.
Diamond trading patterns
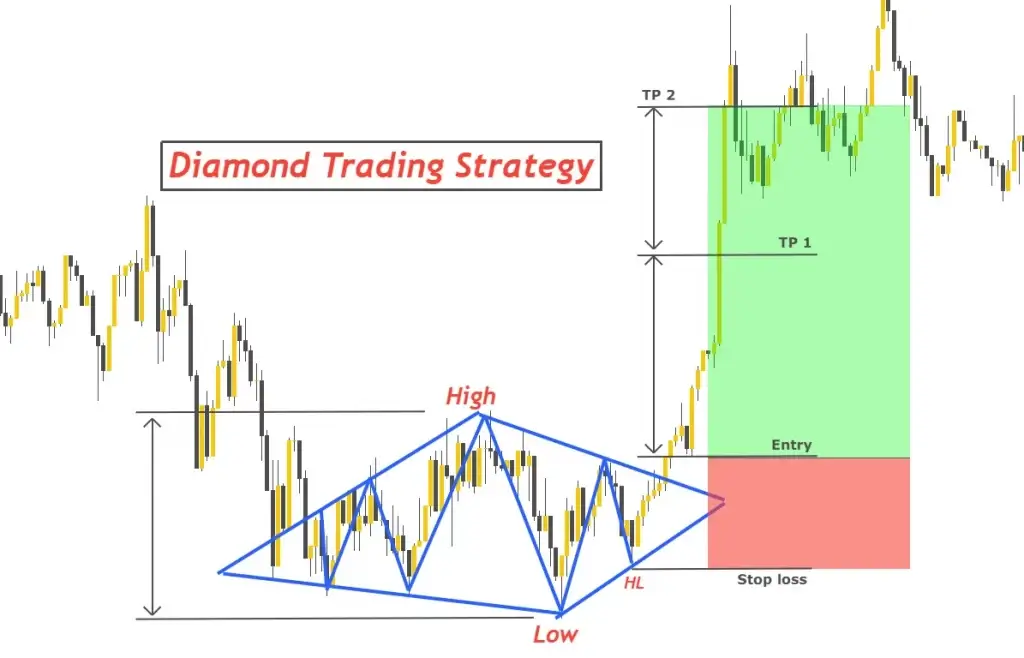
Diamond graphic patterns are sometimes confused with the head and shoulders formation with a V-shaped neckline. They usually occur at the top of the market, although with some similarities between the formations. It can also be identified as an extraordinary model who is casual in nature.
These chart reversals mostly occur at major highs with high volume and also rarely at market lows. It occurs most often at major peaks and with high volume.
However, a breakout from the diamond chart formation can later carry stocks. However, unlike the commonly seen pennant, head and shoulders, flag, and rectangle patterns, the diamond chart pattern appears less frequently on the price chart.
Diamond pattern trading explained
At the exit of a diamond top, the price drops back to its level preceding its initial uptrend. If you have recognized a diamond top pattern, it is, therefore, time to take a short position for sale at the exit of the diamond (broken support).
However, at the exit of a diamond bottom, it will be necessary to take a position for the purchase when the resistance becomes broken. A diamond dip predicts a rise above the initial price level, so it is better to hold your position following a diamond dip for longer.
A diamond top pattern doesn’t occur too often, but when it does appear, it can be a sign of a strong reversal in trend on the assets. It can be spotted when an uptrend begins to flatten sideways.
So, what does a diamond top look like? The sequence looks as follows:
The price is on the rise; It then begins to fluctuate, with peaks going higher and troughs lower at first. After that, the price action changes, with the peaks being lower and the troughs – higher.
Normally, connecting highs and lows form a diamond-like shape. Note that the diamond does not need to be symmetrical. It can also be tilted slightly to the side.
Diamond Chart Patterns – Identifying and trading the formation
Here is an example of diamond pattern trading. A signal for an entry point for the diamond top pattern is received when the price crosses the support line on the lower right (diamond bottom). This is the confirmation of the price reversal.
Depending on their approach, traders can also take advantage of diamond price fluctuations before the price drops. The important thing is to set a tight stop loss at the support level to possibly reduce potential losses.
Beware that the diamond top pattern is often confused with the head and shoulders pattern. Evaluate models carefully to make an informed decision.
The opposite of diamond highs is the formation of diamond bottoms which occurs after a strong downtrend in a security or currency pair.
An example of diamond bottom formation
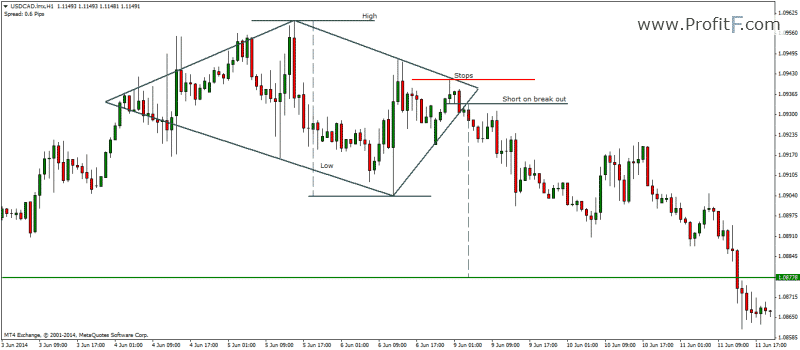
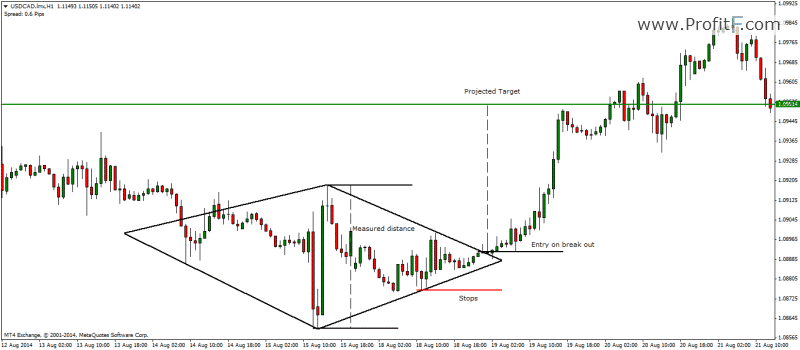
Price falling into the diamond from above indicates that the pattern is a diamond below, not above. The diamond represents the struggle between buyers and sellers in the market: buyers push prices to a new minor high until selling pressure drives prices down.
The broadening pattern may continue for several swings but usually does not last too long. A signal for a buy entry is the price crossing the resistance line on the upside.
In the event that the price crosses the diamond bottoms pattern downwards, decreasing instead of increasing, traders may consider looking for another pattern in this case.
A trader’s job is to find diamonds that lead to a price reversal. The key is to trade with the trend: follow the diamonds with a breakout up in a bull market and a breakout down in a bear market.
Identifying a diamond shape on the chart is not always easy: the key is to look for the shape after a strong uptrend or downtrend with an expanded price range.
Trading diamond patterns can seem a bit complicated – this shape requires a keen eye and a lot of practice.
However, learning to spot this pattern can be useful for both newbie and seasoned traders. Also, note that no strategy or chart pattern guarantees 100% success. Therefore a strong risk management approach should be applied at the same time.
Importance of diamond chart pattern
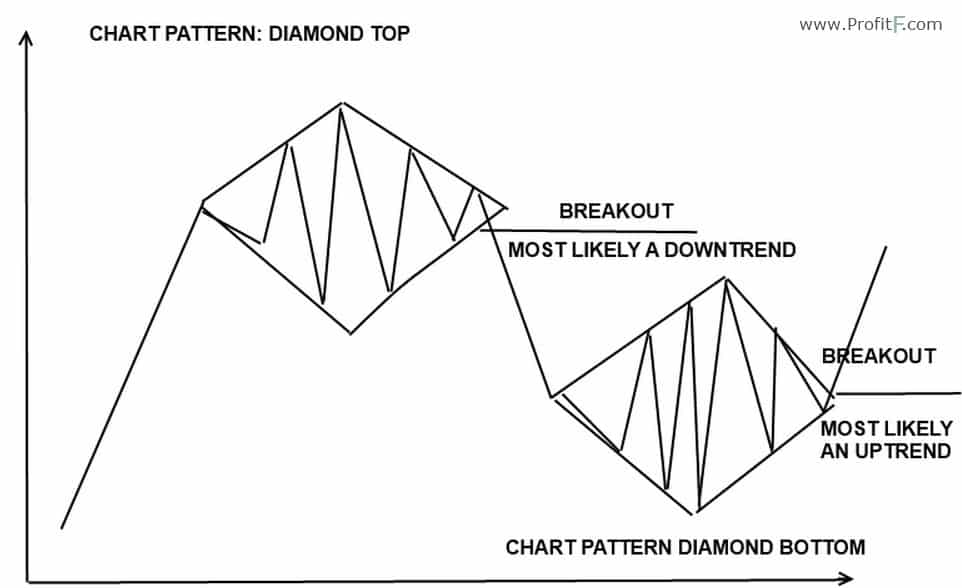
A diamond pattern trading revolves around investor psychology. This model looks at a specific way of taking traders on how the asset is performing.
After a big move, investors are eager to either take profits bullish or a bearish short. This causes the first round of consolidation.
Thereby, there is a period of instability where certain volumes reinforce investors. The pullback is another consolidation that destabilizes the price. Then, the final breakout occurs when investors capitalize on the current level.
Diamond stock patterns are an important tool in trading. It is necessary to use it as part of your technical analysis strategy. They play a vital role in researching market trends and predicting movements.
However, they can be used to analyze all markets, including forex, stocks and commodities. The stock chart patterns are ways to visualize a series of price actions that occur over a period of stock trading. It can happen in any period, but the most important thing is that they repeat themselves over time.
It is not easy to start trading diamond patterns. Indeed, the form requires a sharp eye and constant practice. This often leaves traders guessing when to enter or exit a position. Therefore, you need a solid and accurate approach to correctly spot this pattern. These patterns are rare; meanwhile, they often break up or down regardless of bullish or bearish indicators.
One important thing you should consider about diamond pattern trading is:
- Don’t trade against it until it shows you a definite break.
- The trend could be bearish, but the breakout could also be bullish,
- Or the trend could be bearish as the breakout narrows.
Therefore, every pattern trader must know the basics of a diamond pattern.
Diamond pattern trading mistakes
The biggest mistake a trader can make is trading diamonds too soon. Be sure to draw support and resistance lines after the second half of the diamond as a symmetrical triangle. Whenever the price breaks or crosses either of the thresholds, it signals the direction of the impending price movement.
Another risk of trading a diamond is setting price targets and stop losses. We suggest that there is no technical way to gauge how high or low a diamond breakout might be.
It’s because many traders are sometimes too conservative when it comes to benchmarking. Although most technical traders often calculate the difference between the high and low points of a diamond and then add it to the breakout.
Therefore, the best option would be to look at the initial decline that triggered the diamond using market momentum to predict the level of correction after the breakout.


