What is a Butterfly Pattern in Stocks and Forex Trading?
Analyzing the market’s price trends and fluctuation is vital for better trading decisions. You can use many graph patterns to your advantage when trading stocks, Forex, crypto, or any other market. These patterns could be less or more reliable. However, it is crucial to know how to read them and implement them in your day trading or long-term trading. The butterfly pattern is one of the most common patterns used by seasoned traders.
Using it can be an eye-opener when determining the price trend. What does this pattern look like? How to read the butterfly pattern, and is it a reliable indicator? All these questions and even more we will answer within the following lines. Keep reading to fully grasp the concept of butterfly pattern trading in financial markets.
What is a butterfly pattern?
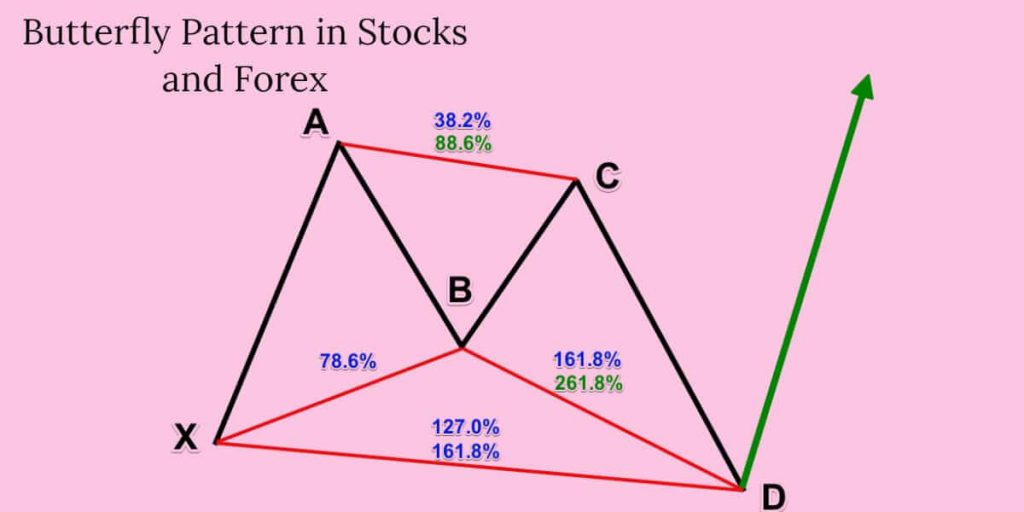
This pattern is part of harmonic patterns and consists of four legs and five points, indicating price reversal. It is similar to the Gartley chart pattern since the legs are marked as AB, XA, BC, and CD.
It is useful for determining the end of the trend in price so you can open the trade during the reversal. You will encounter two versions of this pattern which are bullish and bearish. If you spot a bullish pattern, you will sell the asset. In case of a beamish pattern, you sell out.
However, it’s ultimately important to be precise when determining the moment of exiting and entering the market. According to expert tech analysis, butterflies are a very accurate pattern and also tend to show sharper reversal trends.
What does the butterfly pattern indicate?
Chart analysis is a price analysis method that recognizes recurring figures having a shape, more or less geometric. There are two main families of chart patterns: reversal and continuation patterns. In both cases, these figures offer signals as well as a direction.
The former appears when the prevailing trend continues in the same direction, usually after pausing.
The seconds will signal a change in trend direction. Trend reversals that occur at the top of the market correspond to a distribution phase. Conversely, reversal patterns on market lows are accumulation phases.
Whether it is a reversal or continuation pattern, the longer the pattern will take to form, the more powerful the price movement will be at the breakout of this pattern.
The butterfly pattern indicates the reversal in trend.
As its name suggests, a reversal pattern induces a loss of momentum in progress before a probable reversal of the trend.
In trading, there are two types of reversal patterns:
Upward reversal patterns: which predict the end of a downtrend;
Downward reversal patterns predict the end of an uptrend.
A very important point to remember is that a reversal chart pattern can only be validated when the asset’s price leaves the pattern. In other words, the trend reversal will only occur after the pattern’s formation.
Spotting butterfly patterns can provide valuable help in predicting a course reversal. Detecting them maximizes the chances of a successful trade. It is, therefore, an essential tool for getting started in trading.
Perks of using butterfly patterns in stocks trading
These are very strong indicators and quite easy to spot. It’s one of the most reliable ways to detect the best trading opportunities.
This pattern is widely used to determine stop-loss or target levels. On the other hand, it would be wiser to leave a certain margin in the case of stop-losses to avoid triggering the latter before a price recovery in the opposite direction.
The advantage over other indicators is that their levels are static, unlike moving averages. The static nature of these levels allows quick and easy identification, but also to anticipate reacting accordingly during tests. These levels are inflection points where a reaction is expected, either a reversal or a breakout.
In short, butterfly patterns are considered support and resistance levels. To limit the risks, it is advisable to position oneself in the direction of the major trend.
Disadvantages of using butterfly patterns
There is no perfect chart pattern in the tech analysis, so the butterfly pattern also has its own downsides. You should be mindful of the following disadvantages when using this pattern in your Forex, stocks, or crypto trading.
First, every harmonic pattern demands thorough and in-depth tech analysis knowledge, be it butterfly, shark, or any other harmonic pattern.
Also, for better accuracy, you should combine several harmonic patterns in order to determine the ends and make a good trading decision.
Therefore, it really requires a lot of patience and detailed research. Traders usually find other patterns more practical in terms that they are less rigid. If you are a beginner, you can find this pattern frustrating for analysis and putting it in context.
So make sure you first grasp other tech analysis concepts before starting with the butterfly pattern.
How to spot butterfly patterns in the graphs
This pattern is similar to the letter W or sometimes the letter M.
The harmonic butterfly pattern is a price formation consisting of 5 points that define four price fluctuations. Bryce Gilmore discovered it in 1935.
However, the exact relationships (defined by the precise Fibonacci ratios) between the trends that make up the pattern were defined by Scott Carney in his book “The Harmonic Trader,” written in 1998. Their presence indicates a strong probability that the market will change direction.
- It is a five-point pattern formed by four price trends.
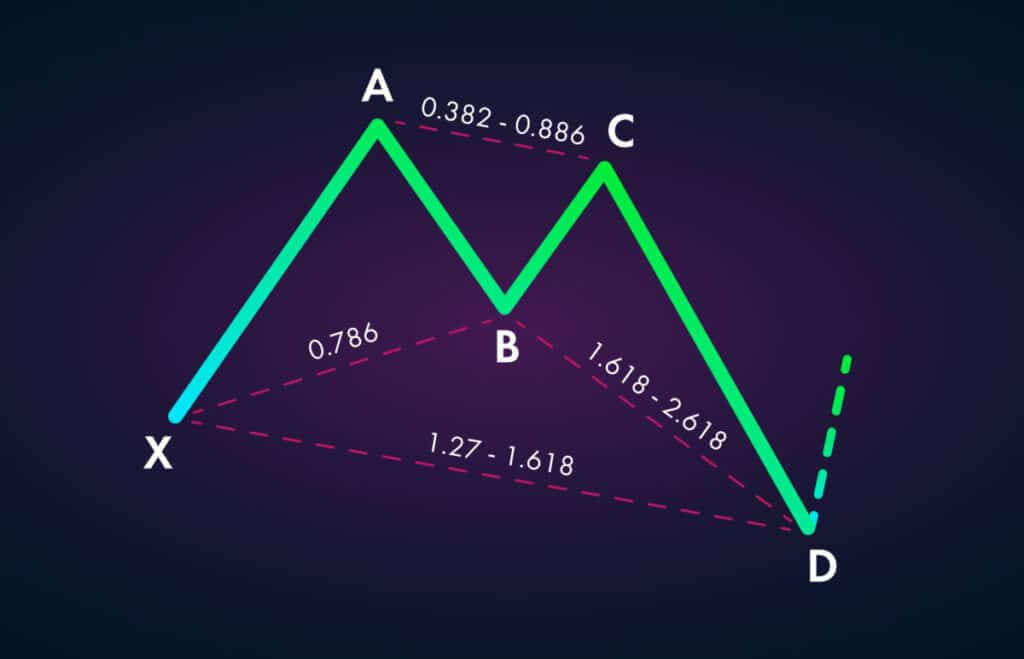
- The AB trend must be equal to 78.6% of the XA trend.
- The BC trend is a 38.2% or 88.6% retracement of AB.
- If the BC retracement is 38.2% of the AB trend, then the CD trend should be a 161.8% extension of the CB trend.
- If the BC trend is 88.6% of the AB trend, then the CD trend must be a 261.8% extension of the BC trend.
- The CD trend should be a 127% or 161.8% extension of XA.
Once the diagram is completed in D, we have the potential investment zone, where we can buy or sell since there is a probability that the price will change direction.
Identify bullish and bearish trends using a butterfly pattern.
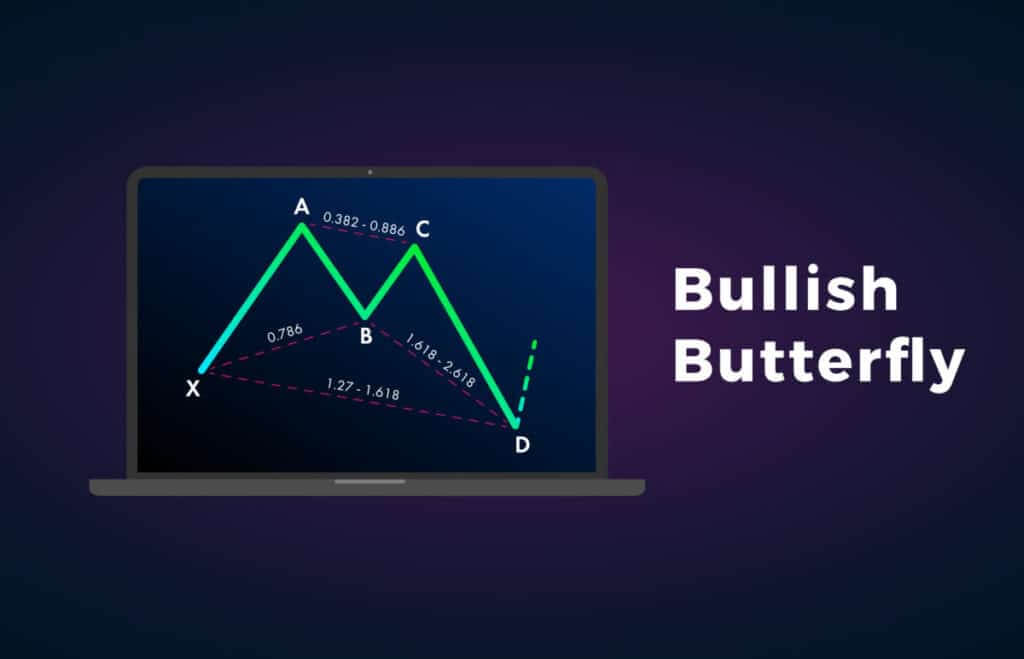
Using the butterfly pattern can help traders identify bullish and bearish trends. When the X and point D is located lower than B and C, we are talking about the bullish trend in the market. Once point D gets the full retracement, the prices are likely to increase; therefore, we have the setup for a bullish market.
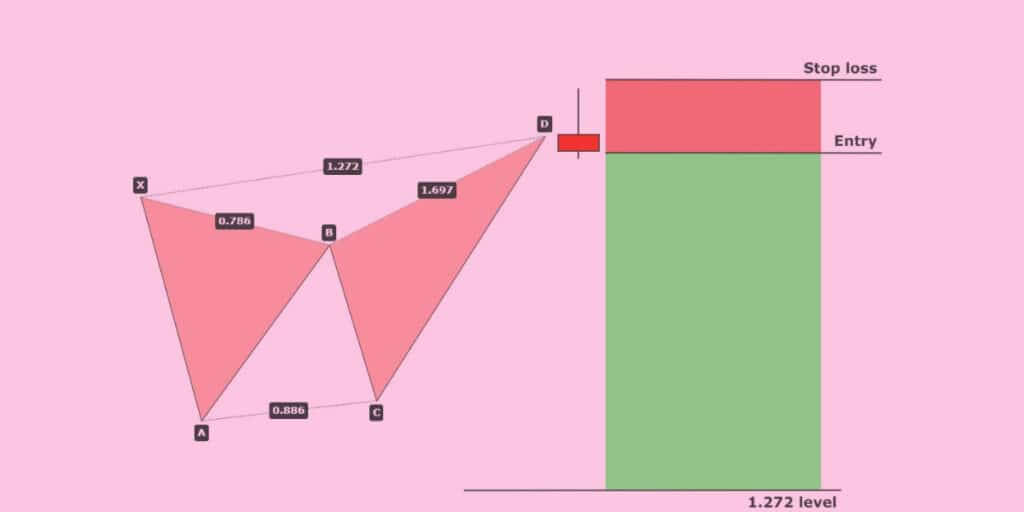
When X and D are above points A and C, we have the bearish trend setup. When the CD pattern reaches full retracement, the butterfly pattern announces the price decline.
This approach can help you in setting the stop loss order below or above point D to decrease the chances of loss in case your prediction is wrong. Combining this pattern with a volume indicator can help you know how long to remain in a trading position before closing the trade.
Trading rules when using butterfly patterns.
Here are the most fundamental principles concerning butterfly patterns:
The beginning stage is the XA leg, which is the basis of all that follows the leg.
- The AB line can’t surpass X point
- The BC leg can’t surpass A point
- The CD should surpass X
- The closure point of D in the CD line should be equivalent to or outperform point B.
It’s likewise essential to take note that the butterfly should have an “AB equals CD,” which is a minimal prerequisite.
Final Thoughts
With harmonic chart patterns like butterfly patterns, you can definitely perfect your technical analysis. When you graphically analyze the price of a stock, for instance, your eyes are mainly riveted on your technical indicators like the RSI or the MACD. But the signals provided by the chart patterns are also reliable for taking trading positions.
Chart patterns are recurring and widely used configurations in technical analysis. They offer quality and reliable predictive technical signals to determine the upcoming trend.
However, you need a seasoned eye for reading graphics to spot figures that meet all the prerequisites, especially since these figures are never absolutely perfect! You don’t need to know them all. Focus on the ones that are easy to spot and offer the best results.
Using a butterfly pattern can be an eye-opener when determining the price trend. The butterfly pattern indicates the reversal in trend. As its name suggests, a reversal pattern induces a loss of momentum in progress before a probable reversal of the trend. These are very strong indicators and quite easy to spot. It’s one of the most reliable ways to detect the best trading opportunities.
Finally, for better accuracy, you should combine several harmonic patterns in order to determine the ends and make a good trading decision.
Seasoned traders, in order to create their original strategy, always mix indicators, patterns, and Dojis. So make sure your strategy also is fine-tuned by not only relying on one pattern or indicator when trading whatever market you choose.


