Falling three methods – how to use them in trading
During your dedicated trading career, have you ever wondered what the falling three methods pattern is? Why has this type of trading pattern become so popular with traders of all profiles and preferences over the years?
Regardless of your level of expertise in trading and past successes, upgrading your knowledge in this industry is more than desirable if you have long-term goals to be successful. It is not easy to survive in a dynamic and volatile market, especially when there is huge competition.
Therefore, it is not surprising that there is a need to learn the various types of chart patterns and available strategies that can improve one’s results. Falling three methods will be very helpful for you to know and master to generate profits in the long run successfully.
So, before we know all the essential information about the falling three methods, let’s find out what this pattern represents in the first place. Furthermore, we will also look at some specificity of the rising three methods pattern.
Falling three methods key takeaways
- Falling three methods candlestick pattern definition
- The rising vs. falling three methods
- Why is falling three methods pattern useful
- How to spot falling three methods in chart analysis
- Determining stop loss and take profit with falling three methods
- Determining Your Take-Profit Level
- Combining falling three-method pattern with other indicators
Falling three methods candlestick pattern definition
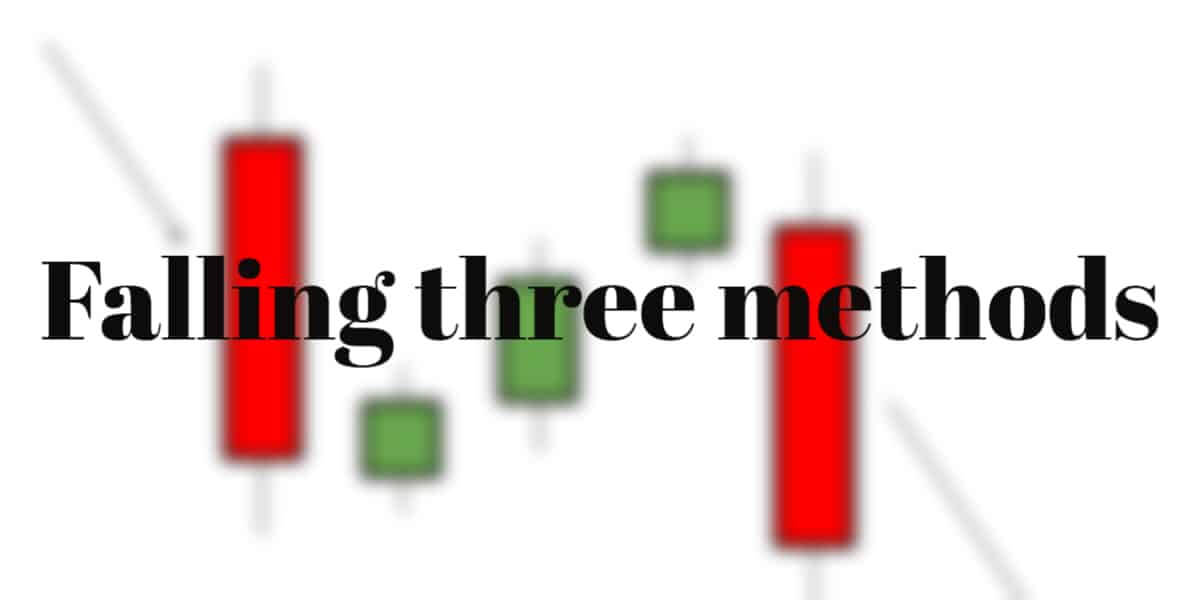
The falling three methods are a bearish market signal showing that the bulls still don’t have a sufficient conviction to reverse the trend. It represents a continuation trend pattern in a bearish market. It shows a current trend continuation and occurs in a bearish market trend. Falling three methods pattern consists of five Doji candles. The first and the last ones are bearish candles. They go in the direction of currency trends. Following the first bearish candlestick, the second to fourth shows the inversion momentum. The last candle is bearish and forms the continuation candlestick pattern.
The pattern is called the Rising three methods in case we have an uptrend.
Therefore we are talking about the patterns aiming to predict the bearish and bullish trends in the market. Concretely, these patterns predict the trend continuation in the financial markets. These five candlestick patterns are particularly useful if you are prone to short-term trading strategies.
The rising vs. falling three methods
The rising three is a bullish continuation that creates inside a bullish pattern. The rising three techniques are something contrary to the falling three strategies design. In it, the first and last candles are bullish. The cost will probably pursue the predominant bullish direction when the candle development is finished until a critical inversion situation shows up.
The falling and rising three strategies are pattern continuation indicators, an essential pattern that shows a consolidation of the trends.
They are also showing the interruption in the market trends. In the three falling methods, the pattern shows that the bears are overtaking the market trend.
Why is falling three methods pattern useful
Traders can exploit pattern continuation graphs when the prices move inside a pattern. In any trading system, using patterns gives a higher likelihood of profits. One of the fundamental qualities of a trend continuation pattern is that asset prices follow a continuation pattern. This idea impeccably matches the rising three and falling three patterns.
A price movement happens when the asset’s price sharply develops with solid momentum. After momentum, price correction takes place while scarcely making new highs or lows. You will see this price movement appearing after correction, announcing the continuation of the trend.
The falling three methods and rising three show a similar impulse correction chart model that assists traders with recognizing forthcoming price movements.
How to spot falling three methods in chart analysis
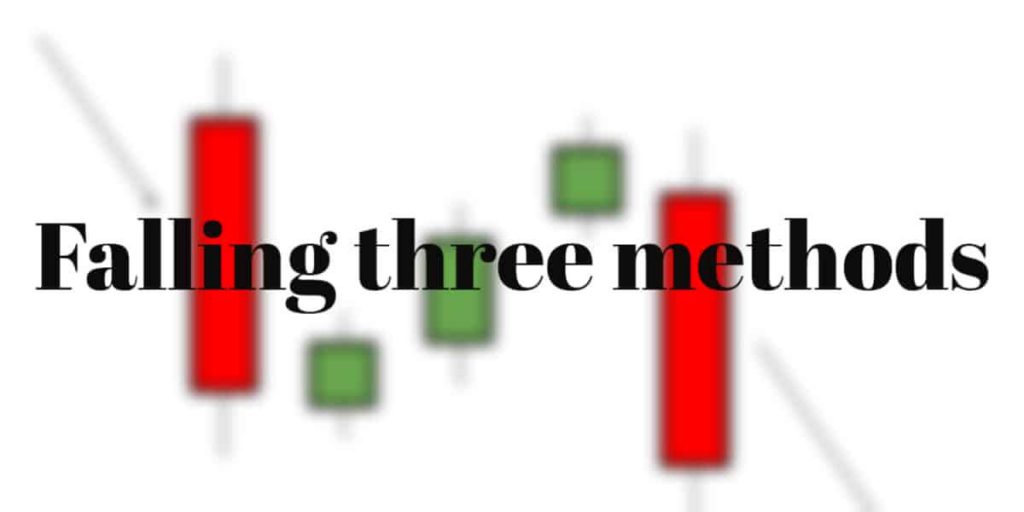
So how to spot this pattern in tech analysis charts? This pattern combines at least five candles: three bullish and two bearish candles. Concretely, the pattern of falling three methods represents one bearish followed by three bullish candles, ending with one bearish candlestick. It needs to meet the following important criteria.
You first need to spot the bearish candlestick with a long body and short tale. This candle is forward by bullish candles represented in green color. The bullish candles’ bodies are smaller compared to the first candle. They don’t break the first candle high. The last bullish candlestick is followed by the bearish one in red color and completes this candle pattern. Finally, the last candlestick closes below the low of the first candle. Its body cannot be as solid as the first candle’s body.
How to read falling three methods pattern
Now that we have explained what falling three methods is in tech analysis for traders, we have to see how to implement the pattern in trading sessions.
First, you must follow specific rules related to stop loss and take profit points in financial markets trading. Also, you must follow specific risk management rules. Let’s see what it looks like.
When trading relying on this bearish pattern, you should pay particular attention, particularly to the last candle. It shows the continuation of the bearish trend after the correction.
In this situation, the assets’ value increases as long as you trade within the last candle’s body. If the price goes down and below the first candle’s low, trend continuation is not valid.
Here you should go with an aggressive approach by setting your stop loss point below the final bullish candlestick. The usual approach would be setting your stop loss before the lows of the first candlestick. When it comes to raising three methods, similar rules apply.
Besides, you need to pay attention to trading volumes when trading this pattern. Most traders are prone to go short when they see bearish signals. However, it is important to check if the volumes of short green candles are lower than the red bearish ones.
Determining Your Take-Profit Level
Once your trade is open, you should wait for a valid reason to exit the trade. Using a rising method pattern, you must hold the trade until a strong resistance level.
Then, you should search for significant price barriers within the higher time frames. Conversely, with the falling three methods, you should exit the trade once prices get to important support levels.
Using the falling three methods with other technical indicators
The three falling methods represent the bearish chart pattern. But to confirm its prediction, you need to refer to other reliable indicators.
Combining the three falling methods with other technical indicators increases the profit probability. Here are some indicators to use additionally to increase your odds for profit.
Moving Average
The moving average is an indicator frequently used by investors because these averages often provide support or resistance. The simple moving average and the exponential moving average are the most used moving average indicators. This indicator can be used with other indicators, such as RSI and MACD.
The moving average indicates the direction of the trend. A rising average is a positive sign. A falling average indicates a downward trend. As the 50-day average covers a shorter period, this line is generally more mobile.
A 200-day average is a good tool for predicting highs and lows. As many investors use this indicator, the price often bounces off this line. Of course, not all highs and lows are around the 200-day average. Nevertheless, with the graph below, it is clear that this indicator can indeed have an influence.
MACD
Moving Average Convergence Divergence” is used during technical analysis, which aims to predict the trend of a price. The MACD, therefore, makes it possible to visualize buy or sell signals. A histogram is associated in order to work on the divergences.
The advantage of the MACD is that it is a more reactive indicator than studying moving averages. A change in trend can therefore be detected earlier. The downside of the MACD is that it is risky. It is a tool suitable for short-term trading (see Day trading ) and must be associated with other analytical tools.
Falling Three Methods pattern – Bottom line
The falling three methods are a bearish market signal showing that the bulls still don’t have a sufficient conviction to reverse the trend. It can help traders create a foolproof trading strategy. It represents a continuation trend pattern in a bearish market.
This pattern combines at least five candles: three bullish and two bearish candles. Concretely, the pattern of falling three methods represents one bearish followed by three bullish candles, ending with one bearish candlestick. When trading relying on this bearish pattern, you should pay particular attention, particularly to the last candle.
It shows the continuation of the bearish trend after the correction. In this situation, the assets’ value goes up as long as you trade within the last candle’s body. If the price goes down and below the first candle’s low, trend continuation is not valid.
This trading method is effective in any financial asset trading. However, it’s not wise to rely only on this indicator. Consider using moving averages and other market trend indicators to get a clear picture of the market’s behavior and sentiment.


