3 Drives Pattern in Forex – Everything You Need to Know
Have you ever thought about the 3 drivers pattern and how it is useful to traders worldwide? Why are numerous ambitious traders eager to learn more about it and try to maximize their profits with its proper usage?
First of all, using valuable chart patterns along with technical indicators is the combination that enables traders to make the best possible decisions while trading. In the dynamic Forex market, it’s especially crucial in order to acquire significant profits.
However, chart patterns, such as the 3 drives pattern, offer more value to traders than technical indicators because they provide powerful insights into the psychology of the market, thus making them a supreme tool for ambitious traders worldwide.
Why is the 3 drives pattern so special, and why should traders get all the essential information about it? Let’s find out!
What is the 3 drives pattern exactly?
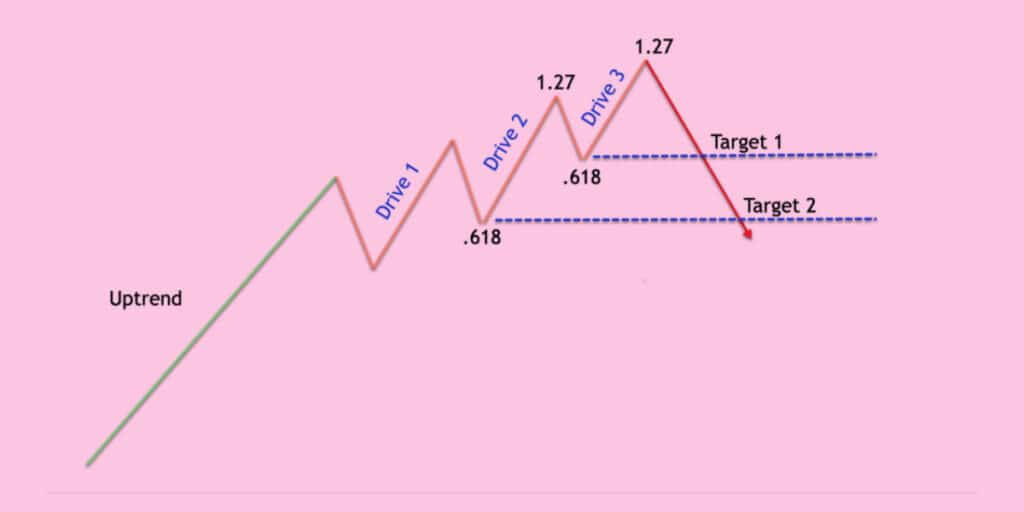
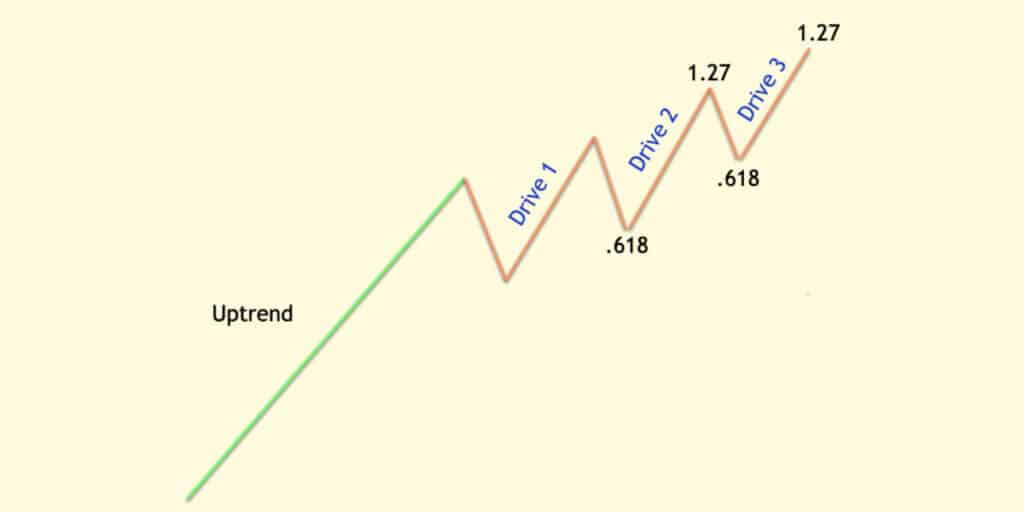
The 3 drives pattern represents a particular reversal pattern comprising three legs, usually called “drives,” and two corrections. It is self-sufficient, meaning that it includes diverse exit and entry points. It includes 3 swings that have the same direction and length.
Fibonacci ratios are what this particular pattern conforms to. The reason for that is to identify potential reversal zones. It’s identified by different series of lower lows and higher highs. They complete either 161.8% or 127% Fibonacci extension.
Also, the 3 drives pattern is able to indicate the market’s exhaustion in its present move. Thus the expected reversal might happen in the price chart.
An ancestor of the Elliott Wave Pattern
Traders consider the 3 drives pattern an ancestor of the famous Elliott Wave Pattern that utilizes a more complex series of “drives” or so-called “waves.” It’s crucial for pre-determining price behaviors in the long run.
Bullish and bearish versions of the 3 drives pattern
Regarding 3 drives pattern in Forex, it’s crucial to know that you can find two different versions of it:
- Bullish 3 drives pattern
- Bearish 3 drives pattern
Traders interested in the bullish 3 drives pattern should know that this particular version is best used for identifying plausible purchase opportunities. On the other hand, the bearish 3 drives pattern exists for traders to identify possible sell opportunities in the market.
Bullish 3 drives pattern
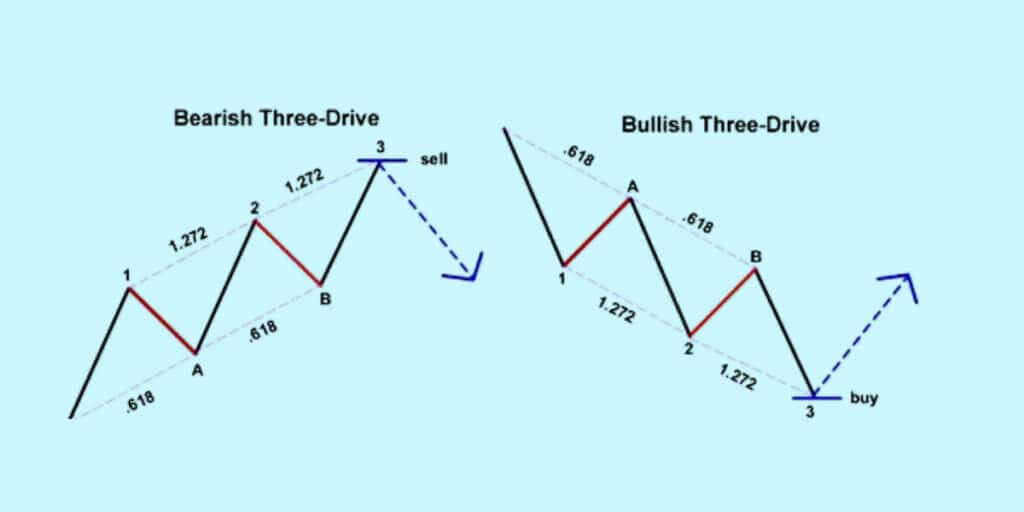
The bullish version of this pattern starts with a bearish swing to provide traders their first drive opportunities. There’s a greater retracement into the 61.8% level than the first drive. It enables traders with the A point.
The price gets less once again from this particular point to provide the 2nd drive. The drive is expected to finish off into the first drive’s 1.27% extension. From this point, the price rectifiers are greater once again.
The retracement of the second impulsion at 61.8% forms the B point, and the price subsequently experiences a last decrease to reach the 1.27% prolongation of the second impulsion, thereby finalizing the formation and creating a buying area. The pattern is complete, and traders can take advantage of the buying zone.
Bearish 3 drives pattern
The bearish version of this pattern starts with a bullish move, i.e., the first drive. Afterward, a lower retracement provides a certain A point expected to complete into the 6.18% to 78.6% retracement of the first drive.
Following the initial drive, another upward progression will materialize, bringing the second leg to its conclusion at the 1.27% extension. This will be followed by regression, confined to a range between 61.8 to 78.6% of the second drive, and signal the B point.
Traders will then look for a last surge upward, which will end at the 1.27 percent extension of the second drive, thus forming the third wave and providing an opportune moment to sell. As the pattern ends, traders can take advantage of the selling point that the formation has created.
How to effectively recognize the 3 drives pattern?
Identifying the famous 3 drives pattern in the volatile Forex market might be challenging. Thus, it’s always essential to know the key elements of it that might help you recognize this pattern most effectively.
The famous three drives harmonic pattern can easily be identified by diverse three higher or lower highs. These highs and lows assemble in the existing trend’s reversal. As mentioned earlier, movements, either lower or greater, get evaluated by the Fibonacci extension and retracement levels that could either be 127.2% or 61.8%.
Rules that assist traders in identifying the 3 drives pattern
Here are the most important rules that traders should consider once they’re about to identify the 3 drives of pattern trading:
- Drive 1’s retracement must be 61.8% for Correction A to be valid.
- Similarly, Correction B’s retracement must be 61.8% of Drive 2.
- The second drive has to reach a 1.272 extension of the famous A’s correction.
- Drive 3 is required to be a 1.272 extension of B.
The volume following every drive is crucial.
We must pay attention to the volume following every drive, lower or higher. It’s crucial since during these drives in higher, rather than through adjustments, traders should be able to have more trust in a possible trend change and submission following the last drive.
The 3 drives pattern designates three previous attempts at operating the price significantly lower than before realization happens. Therefore, the trend is set aside.
How to utilize the 3 drives harmonic pattern the best?
The three-drive pattern is valuable for identifying trend reversals and making strategic trades. Motivated traders effectively use it to spot valuable trend reversals. This pattern can provide traders with the opportunity to capitalize on the change in direction or exit current positions.
For instance, when a trend reversal turns bearish, it can encourage traders to close their points or enter new short trades in anticipation of the trend reversing over time.
How are trade signals generated?
Usually, valuable trade signals are arised once the 3 drive pattern is finalized at drive 3. However, numerous traders in the market establish limit orders. These orders are usually established at the famous 1.272 extensions. To elude excluding the reversal, it follows B correction.
Placing the price somewhat beyond the precise reversal point is able to improve the probability of a lucrative fill, despite the fact that there’s a greater downside risk.
Where are stop-loss levels set?
Stop-loss levels are usually established precisely upon or beneath the reversal spot. If the price continues to accelerate or drop, the market or limit order is able to rapidly quit as soon as the chart pattern malfunctions. Setting the stop-loss adequately distant from the reversal spot. It is crucial to bypass resulting in cutting short of an otherwise successful trade from volatility.
The place where drive 1 started, it’s typically where take-profits points are established. Nonetheless, in case the trend provides us with continuing indications, it’s essential for them to possess the point prolonged and then utilize the start of drive 1 since the additional stop-loss point will lock in profits during that process.
It is advisable to validate predictions of reversal using other chart patterns and indicators when employing technical analysis. For instance, a neutral corresponding strength index value, around 50, is able to result in a trader doubting a reversal prediction, while an utmost RSI value could serve as confirmation of an impending reversal.
How to trade with the 3 drives pattern?
One can take several beneficial steps to trade using the 3 drives harmonic pattern successfully. Let’s start from the beginning:
- Enter the trade: Consider the first, second, and third drive and a long entry when placing a buy order.
- Set your stop loss: It’s crucial to set your stop loss under the second impulse’s 161.8% Fibonacci extension point.
- Place your authentic profit target: To identify a profit target, use Fibonacci retracement by drawing a line between the highest and lowest point of the pattern. Look for key levels where it may be complete or reversed. In this case, the target is at the completion of the third wave.
What information can you expect from the 3 drives pattern?
If you were wondering what type of information the 3 drives pattern Forex gives you, it’s crucial to know that there are 3 symmetrical, authentic, and successive drives to a bottom or a top. It is crucial not to impose a pattern on the chart. Symmetry in both time and cost is vital. It is wise to abstain from trading it if it is not discernible.
When the third wave concludes, a change in trend is likely to occur. Traders can set their objectives as they wish, but it commonly exceeds the previous retracement. Conservative traders look for further validation that cost is reversing.
The pattern of three waves can either indicate a bearish or bullish trend. However, if the formation does not emerge, this could signify a robust continuation of the previously dominant movement.
Summary
The famous 3 drives pattern refers to a specific technical analysis tool used in the volatile and dynamic Forex market. It is usually utilized by traders eager to identify potential reversal points. It is characterized by three distinct price waves, everyone with a higher high or lower low and two retracements in between.
This pattern is considered reliable once it shows symmetry in both time and price. Traders are able to determine their targets at their discretion, but it normally goes beyond the last retracement. Also, the 3 drives’ harmonic pattern can either be bearish or bullish, indicating a potential reversal or continuation of the current trend.
Traders should be cautious and look for further confirmation before entering a trade based on this pattern. If the pattern does not appear, it is best not to trade it.


