EURGBP Technical Analysis: Resistance at 0.85500 Level
- EURGBP was in retreat yesterday from 0.85660 to the support level of 0.85495.
- EURCHF continues with last week’s bullish trend.
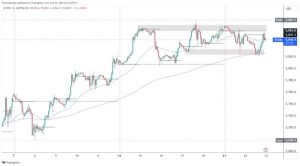
EURGBP chart analysis
EURGBP was in retreat yesterday from 0.85660 to the support level of 0.85495. During the Asian trading session, we look to get support at that level and start a bullish consolidation at the 0.85600 level. For today, we encounter resistance and fall below the 0.85500 level. Additional pressure is created by the EMA200 moving average, and now we hope for a new bullish impulse and a jump above the 0.85600 level.
By doing so, we would move away from EMA200 and could more easily start further growth. Potential higher targets are 0.85650 and 0.86700 levels. If we happen to fall below the 0.85500 level and the EMA200, we return to the bearish side. We would be forced to form a new low and thereby confirm the bearish momentum. Potential lower targets are 0.85450 and 0.85400 levels.
EURCHF chart analysis
EURCHF continues with last week’s bullish trend. Yesterday, in the Asian session, the euro was under pressure, and this led to the formation of a low at the 0.95600 level. After receiving new support at that level, bullish consolidation followed. This led to a jump above last week’s high and the formation of a new one at the 0.96220 level. Everything indicates that we can expect a continuation on the bullish side.
Potential higher targets are 0.96300 and 0.96400 levels. For a bearish option, we need a pullback below this morning’s Asian low at 0.69000. With a drop below, we will form a new daily low, and thus, we get increased bearish pressure on the euro. Potential lower targets are 0.95900 and 0.95800 levels.


