Ripple and Tron: Tron very close to the 0.125000 level
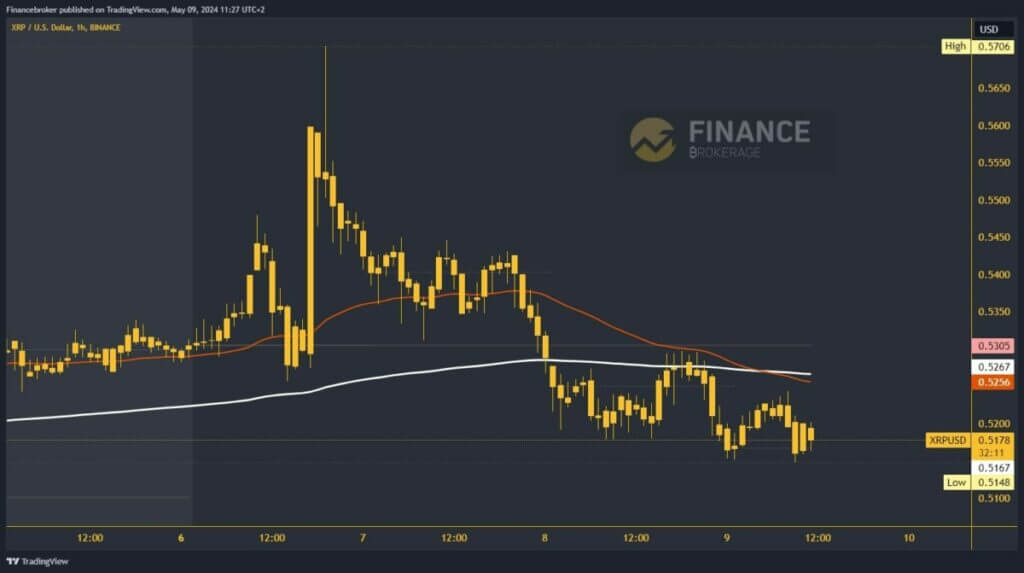
- The price of Ripple this morning retreated to a new weekly low at the 0.5148 level.
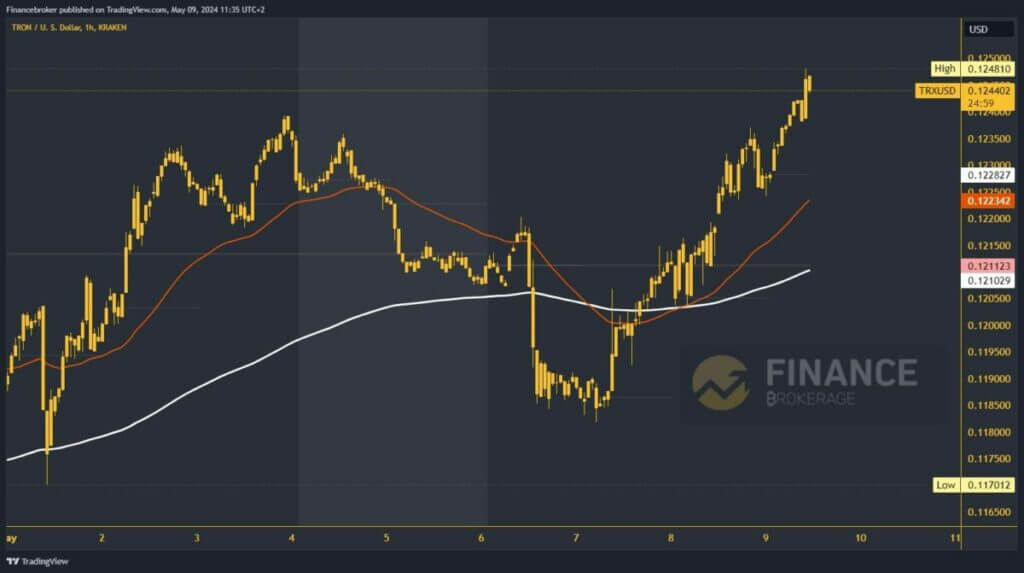
- The price of Tron is in a stable bullish consolidation with the formation of a weekly high at the 0.124810 level.
Ripple chart analysis
The price of Ripple this morning retreated to a new weekly low at the 0.5148 level. After we broke below the EMA200 moving average yesterday, there was increasing pressure on the price to start a pullback. That’s what happened after trying to get back above the EMA200 and testing the weekly open price. Today, we remain in the support zone with a slight bearish trend. We expect to start a further pullback and form a new weekly low.
Potential lower targets are 0.5100 and 0.5050 levels. We need a positive consolidation above the 0.5250 level for a bullish option. This brings us back to testing the EMA200 moving average. We are close to the weekly open price above and could test it soon. By moving above, the chances of seeing the price of Ripple at higher levels increase. Potential higher targets are 0.5350 and 0.5400 levels.
Tron chart analysis
The price of Tron is in a stable bullish consolidation with the formation of a weekly high at the 0.124810 level. There is a good chance that we will see a continuation of this consolidation and climb even higher. Potential higher targets are 0.125000 and 0.125500 levels. That would bring us back to the movement zone from March. If the price stops and loses strength and momentum, we will see the initiation of bearish consolidation.
Falling to the 0.123000 level, we come down to testing the daily open price. A step below moves us to the negative side and leads to the formation of a new daily low. This increases the pressure on the price to start a further retreat. In the zone around the 0.122500 level, we could get the first support in the EMA50 moving average. If it does not last, the next important target is the EMA200 and the weekly open price at the 0.121000 level.


