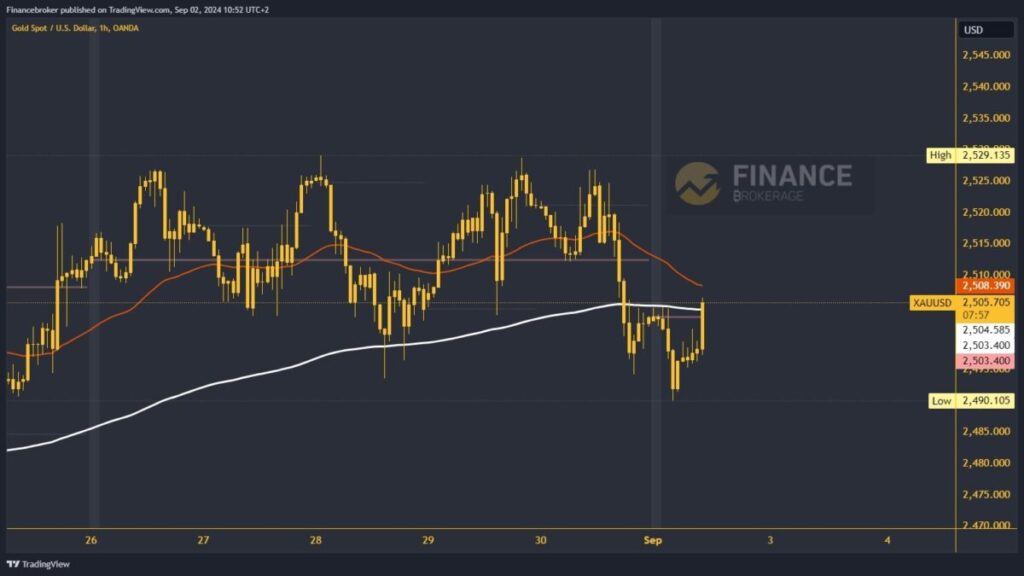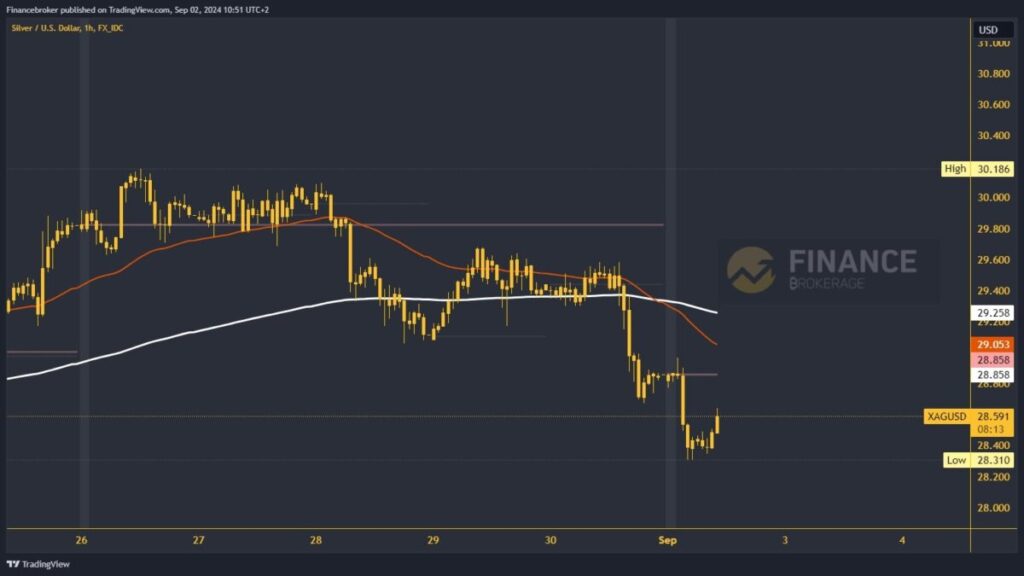
Gold and silver: Gold fell to a seven-day low this morning
- Last week’s gold price movement took place in the $2500-$2530 range
- During this morning’s Asian session, the price of silver was under strong bearish pressure, and we saw a drop to the $28.31 level
Gold chart analysis
Last week’s gold price movement took place in the $2500-$2530 range. On Friday, before the market closed, gold indicated that we could start a pullback below the $2500 level. During this morning’s Asian session, the price broke to $2490, thus breaking through last week’s low. With this step, we get a hint of a possible bigger pullback with the formation of a new lower low.
Potential lower targets are the $2485 and $2480 levels. For a bullish option, we need a positive consolidation and price jump above $2505 to break the EMA 200 moving average. Up there, we expect moving average support to continue on the bullish side. We are also returning above the daily open price, which could further strengthen the bullish momentum. Potential higher targets are the $2510 and $2515 levels.
Silver chart analysis
During this morning’s Asian session, the price of silver was under strong bearish pressure, and we saw a drop to the $28.31 level. After a short consolidation in that zone, the price started a bullish recovery to $28.60. For a bullish option, we need a continuation to $28.90 to break the daily open price. Then, it is necessary for silver to stabilize there in order to have a position to initiate a bullish consolidation.
Potential higher targets are $29.00 and $29.20 levels. In the $29.20 zone, the price will meet the EMA 200 moving average, which could be a stronger obstacle to our further recovery to the bullish side. For a bearish option, we need negative consolidation and momentum below $28.30. With that, we go to a new daily low and confirm the bearish momentum. Potential lower targets are $28.20 and $28.00 levels.


