Dogecoin and Shiba Inu: Doge is in a sideways consolidation
- The price of Dogecoin stopped yesterday’s bullish rally at the 0.09950 level
- This morning, the Shiba Inu price climbed to a new two-day high at the 0.00001370 level
Dogecoin chart analysis
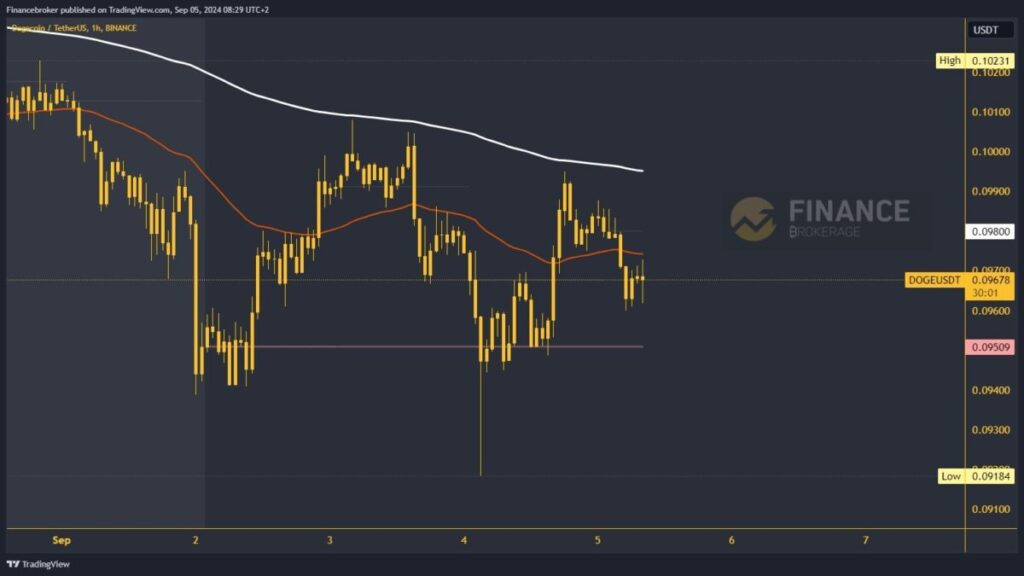
The price of Dogecoin stopped yesterday’s bullish rally at the 0.09950 level. The price formed a new lower high compared to the previous day. After that, a bearish consolidation was initiated, and there was a pullback to the 0.09600 support level. For now, we have support here and are recovering slightly to the 0.09700 level. We need another move up to move above the EMA 50 moving average and get its support.
With the support of the EMA 50, the price of Dogecoin would have the opportunity to continue on the bullish side. Potential higher targets are 0.09900 and 0.10000 levels. We will have greater resistance in the EMA 200 moving average in the 0.09900 zone. For the bearish option, we expect to see a continuation to the bearish side and a decline to the 0.09500 weekly open price. We have already tested that level several times this week, and it is a key support for us to stay on the bullish side. With the breakout below, we will continue with the previous bearish consolidation.
Shiba Inu chart analysis
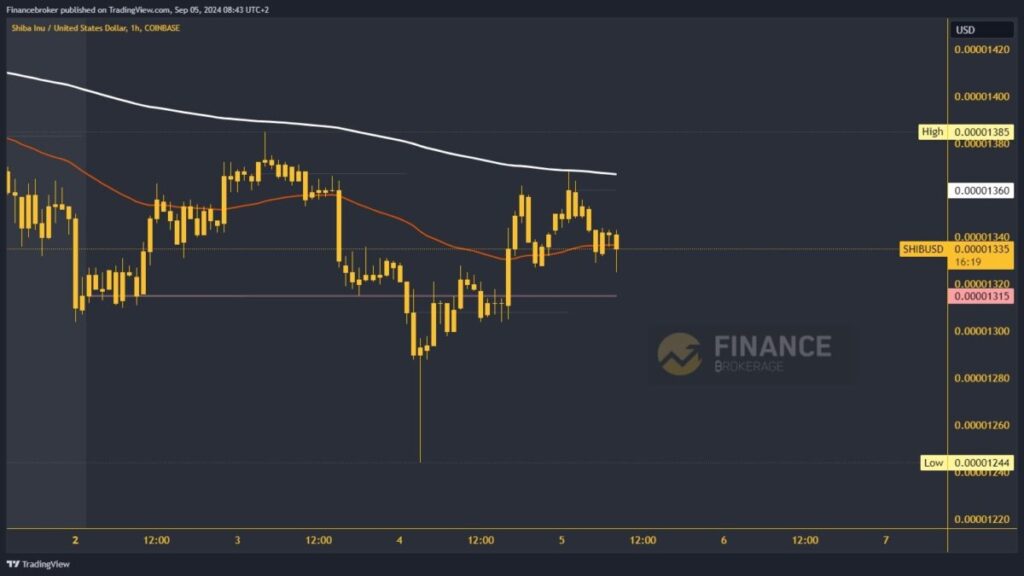
This morning, the Shiba Inu price climbed to a new two-day high at the 0.00001370 level. In that zone, we encountered the EMA 200 moving average, which did not allow us to continue on the bullish side. Cena was forced to initiate a retreat, and that’s what happened. After that, we saw a pullback to a new daily low at 0.00001325. If this consolidation continues, we could test the weekly open price of 0.00001315.
Failure to hold here will create a breakout below and a drop to a new daily low. Potential lower targets are the 0.00001310 and 0.00001300 levels. For a bullish option, we need a positive consolidation back to the 0.00001370 level. This will allow us to test previous highs and try to form a new one. Potential higher targets are the 0.00001380 and 0.00001390 levels.


