SoftBank Group should report a quarterly profit of around 287 billion yen ($1.87 billion), marking a significant rebound from its 931 billion yen loss during the same period last year. Favorable portfolio company listings and the strengthening yen against the dollar have largely driven this turnaround, boosting SoftBank’s stock price.
MST analyst David Gibson forecasts a $3.9 billion rise in investment profit for the quarter. Significant income came from the IPOs of two Indian companies: Brainbees Solutions, contributing around $0.9 billion, and Ola Electric, adding approximately $1 billion.
SoftBank’s AI Ambitions and Rising Investments Signal Bold New Moves
The market is eager to see if SoftBank, led by visionary CEO Masayoshi Son, will sustain its investment momentum, especially in artificial intelligence (AI). Son, who spoke about reserving tens of billions of dollars for significant future investments, recently increased SoftBank’s investment pace to $1.9 billion in the April-June quarter. This marks a considerable rise from $0.3 billion in the first quarter of 2023.
A particularly intriguing development is SoftBank’s exploration into AI chip production, potentially positioning itself as a competitor to Nvidia. This could involve leveraging its 90% stake in the chip designer Arm, possibly through a partnership with recently acquired chip manufacturer Graphcore.
In a recent quarter, SoftBank made an Arm licensing deal worth $43.2 million. This move could support its broader AI ambitions. Analysts are closely monitoring these strategies. They could reshape SoftBank’s portfolio and influence the AI market.
SoftBank Stock Chart Analysis
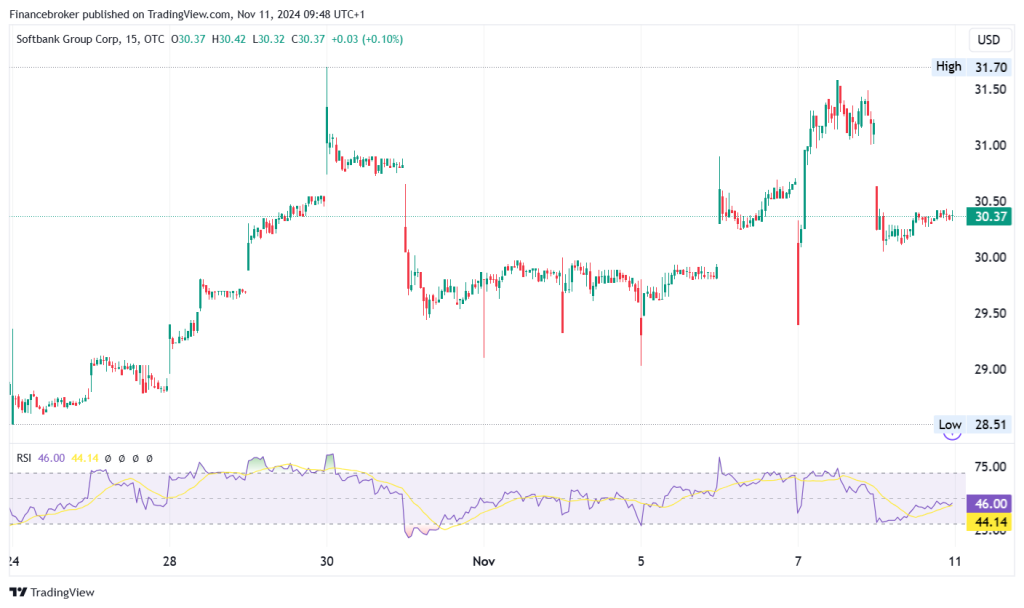
SFTBY/USD 15-Minute Chart
Looking at Softbank Group Corp (SFTBY) stock on this 15-minute chart, we can observe the unfolding of some exciting dynamics. The stock is currently at $30.37, which is, in fact, a small increase of 0.10%.
A strong resistance at $31.70 has prevented further upward movement, while the nearest support is around $28.51. The stock’s slow movement suggests it is in a consolidation phase. Investors should prepare for either a breakout or a breakdown.
The RSI indicator stands at 46, indicating neutral momentum. We’re not quite in the oversold territory, which would suggest a buying opportunity, nor in the overbought range that might signal a sell. When the RSI dips below 30, it indicates a potential buying opportunity. Conversely, when the RSI moves above 70, it suggests the stock might be overextended.
In the short term, if there is a breakout above $31, this might bring out a bullish feeling with the targets being higher. On the other hand, if the stock dips below $28.51, the downtrend could still be unchecked.
We will want to check the volume to verify either a breakout or a breakdown as the strong volume would increase the confidence to move. Maybe it’s time to watch SFTBY very closely to determine whether the price will go up or down.


