Gravestone Doji: What Is It and How to Use It?
In the world of candlestick charting, the Gravestone Doji is a fascinating and enigmatic pattern that has captured the attention of traders and analysts for decades.
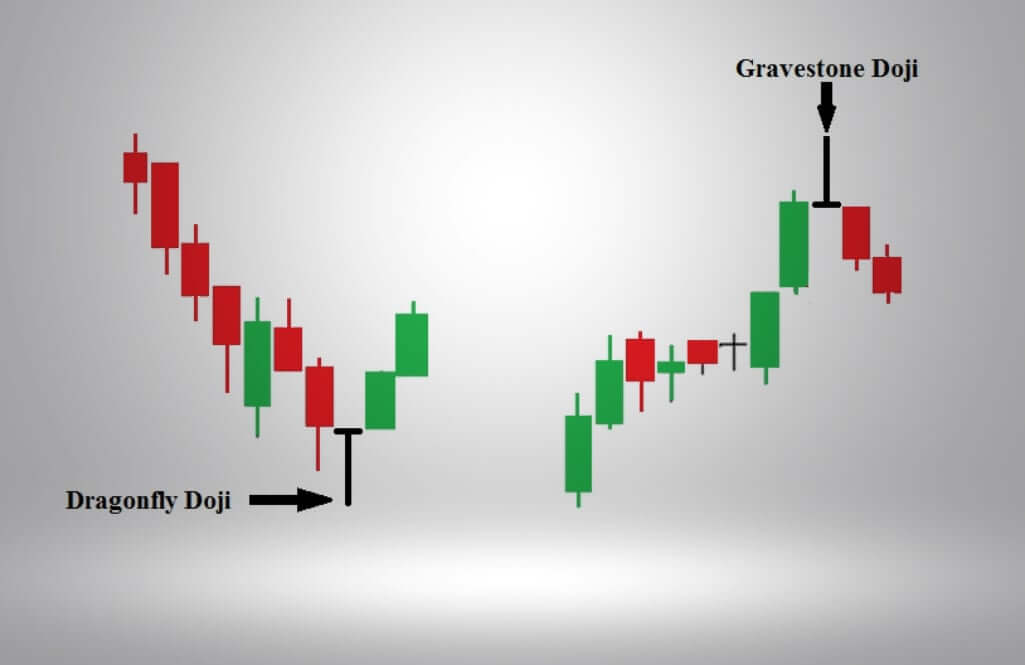
The term gravestone doji refers to a bearish indicator commonly used in trading by technical analysts.
This candlestick pattern, characterized by its unique shape and positioning, provides valuable insights into market sentiment and potential reversals.
Interpreting the gravestone doji:
The gravestone doji is a significant candlestick pattern with various interpretations, and its meaning can vary depending on the broader context of the market. Here are some key interpretations:
Reversal signal: In many cases, the Gravestone Doji serves as a reversal signal. It suggests that after a prolonged uptrend, the bullish momentum may be waning, and a trend reversal or consolidation could be imminent. Traders often look for confirmation from subsequent price action to make informed decisions.
Bearish sentiment: The formation of a gravestone doji reflects bearish sentiment as sellers managed to push prices significantly lower from the day’s high. It can be seen as a warning sign that the bulls are losing control.
Resistance level: The high point of the Gravestone Doji’s upper shadow can act as a resistance level. If prices attempt to move higher and encounter this level again, it may face resistance and struggle to break through.
Caution for long positions: Traders holding long positions should exercise caution when they spot a gravestone doji. It indicates that the current uptrend might be losing steam, and they should consider taking profits or tightening stop-loss orders.
Confirmation needed: While a Gravestone Doji is a significant signal, traders often wait for confirmation from subsequent candles. A follow-up bearish candle or a break below the Doji’s low can provide more confidence in the reversal.
Gravestone doji and dragonfly doji
The opposite pattern of a gravestone doji is a bullish dragonfly doji. The dragonfly doji, which isn’t a very frequent pattern,
The bullish dragonfly doji is relatively rare and appears like a “T” on the chart. It forms when the session’s high, open, and close are nearly identical. What sets it apart from the doji is its notably long lower shadow, which indicates intense selling activity during the candle’s timeframe.
In essence, both these patterns stem from the same underlying concept but manifest differently. When confirmed, one is considered a bullish signal, and the other a bearish one. It’s worth noting that they can occasionally appear in the opposite context, adding a layer of complexity to their interpretation.
The significance of the gravestone doji:
The gravestone doji’s significance lies in its ability to provide traders with valuable insights into market dynamics and potential turning points. Here are some key aspects of its significance:
Market psychology: The gravestone doji reflects a shift in market sentiment from bullish to bearish. It illustrates how a strong opening in an uptrend can lead to a sharp reversal as sellers take control.
Early warning signal: As a reversal pattern, the gravestone doji often appears before a more extended downtrend or consolidation begins. Traders who spot this pattern early can position themselves for potential profit or protection against losses.
Risk management: For traders employing risk management strategies, the gravestone doji offers a clear signal to adjust stop-loss orders or exit long positions. This can help minimize losses and protect gains.
Combining with other indicators: The gravestone doji is most effective when used in conjunction with other technical indicators and chart patterns. Traders often combine it with support and resistance levels, trendlines, or momentum indicators for a more comprehensive analysis.
Timeframes: The significance of the gravestone doji can vary depending on the timeframe of the chart being analyzed. It may have more significance on longer timeframes, such as daily or weekly charts, compared to shorter intraday charts.
Conclusion
The gravestone is a captivating candlestick pattern that offers traders valuable insights into market sentiment and potential reversals. Its unique structure, characterized by a small real body, long upper shadow, and absence of a lower shadow, makes it a distinctive signal of bearish sentiment and potential trend reversals.
Traders who understand the formation and interpretation of the Gravestone can use it as a powerful tool for making informed trading decisions, managing risk, and capturing profit opportunities.
Nevertheless, it is important to remember that no single pattern or indicator is foolproof, and it should be used in conjunction with other analytical tools for a comprehensive view of the market.


