Bollinger Squeeze – Does It Work and How to Profit From?
John Bollinger is a famous financial analyst. What’s interesting, he developed Bollinger Bands. Have you heard about Bollinger Bands? Don’t worry; we are here to help you.
What do you know about “Bollinger Bands” or “Bollinger Bands squeeze?”
Let’s start from the beginning. The vast majority of charting programs include Bollinger Bands.
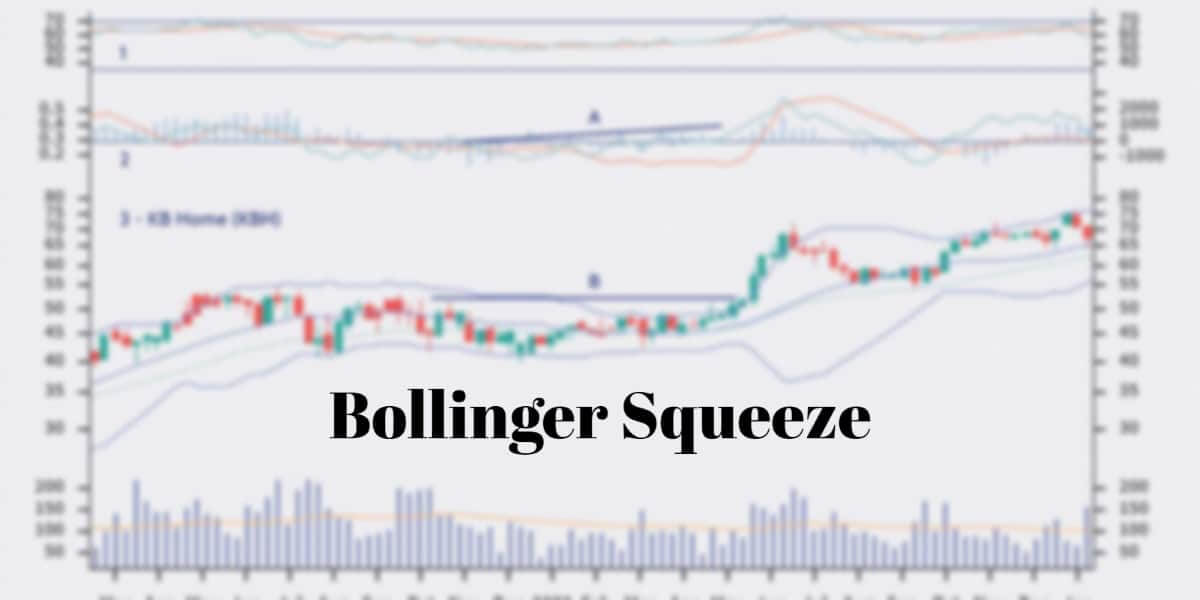
According to John Bollinger, there is one pattern that raises more questions than any other aspect of Bollinger Bands. The pattern mentioned above is “the squeeze.”
It is worth noting that the “squeeze” is the central concept of Bollinger Bands.
First of all, what is a Bollinger Band?
It is a technical analysis tool. Notably, it is determined by a set of trendlines plotted two standard deviations (positively as well as negatively) away from an SMA of a security’s price, but which can be modified according to user requirements. As a reminder, SMA stands for a simple moving average.
As stated above, John Bollinger developed Bollinger Bands. The purpose of Bollinger Bands is to discover opportunities that give investors a higher chance of accurately identifying when an asset is oversold or overbought.
What you need to know about Bollinger Bands

Bollinger Bands isn’t an autonomous trading system. We need to mention that Bollinger Bands are simply one indicator to provide traders with information about price volatility.
What’s important, the developer of Bollinger Bands thinks that it is vital to utilize indicators based on various types of data. Notably, Bellinger likes to use the relative strength index (RSI), etc.
Have you heard about Bollinger band squeeze?
Do you know how Bollinger squeeze can help you spot breakouts?
Importantly, Bollinger Bands spot a stock’s high as well as low volatility points.
While it can be quite tough to forecast future prices as well as price cycles, volatility changes and cycles are comparatively easy to spot.
When Bollinger Bands are far apart, volatility is high. On the contrary, when Bollinger Bands are close together, volatility is low.
A squeeze is activated when volatility hits a six-month low and is spotted when Bollinger Bands hits a six-month minimum distance apart.
What’s next

Let’s continue. Do you know what the next move is?
It is important to learn more about “Bollinger band squeeze.” Hopefully, it will be quite easy to gather more information about the topic. All you need to do is type “Bollinger band squeeze breakout strategy” in Google Search.
The next move is to make the decision about which direction stocks will move once stocks break out. In order to define breakout direction, the developer of Bollinger Bands suggests that it is essential to look to other indicators.
According to Bollinger, it is a good idea to use the relative strength index (RSI) together with volume-based indicators.
To cut a long story short, if there is a positive divergence, it is a bullish sign. Positive divergence? If indicators are going upward while the price is going down or neutral.
On the contrary, if the price is moving upward, however, the indicators are showing negative divergence, search for a downside breakout.
And the third condition is? The third one is the “head fake.”
In his book, John Bollinger advises chartists to beware of the “head fake.” This happens when prices break a band, then unexpectedly reverse and move in the other direction, similar to a bull or bear trap.
To squeeze or not to squeeze?
Bollinger squeeze also has its advantages and disadvantages. For instance, you shouldn’t forget about risk factors.
Bollinger band squeeze is quite popular around the world. However, as in the case of any other strategy, you need to be careful. Do your research, take care of your capital, and know when you should make an exit point, if necessary.


