

Confluence Trading: combining multiple strategies into one
Have you ever thought about what is confluence trading exactly? How can you combine multiple strategies into one to increase your chances of making significant profits in the future? No matter what kind of Foreign exchange trader you think you are and your trading goals, confluence trading is always an excellent choice for many reasons we’ll discuss further in this article.
First of all, knowing the confluence trading definition and its true meaning will help you understand what is it all about and how can you use it in your everyday trading practice. So, let’s begin with the term “Confluence” before we get deeper into confluence trading, shall we?
What is confluence exactly?
The term “confluence” refers to combining multiple strategies and trading ideas that form one complete strategy. The general definition that describes this term the best is when a minimum of two, or more, things of the exact nature converge, agree, or meet on the same basis.
In everyday life, the term “confluence” is mainly used to describe a geographic point where two or multiple different rivers come together and form one body of water. The same logic is also used in the context of trading to express the confluence of various signals.
In a nutshell, the concept is best described as the area in the trading market once at least two or more structures come together to form a high probability of a buy/sell zone.
When does it occur?
It occurs once multiple technical analysis methods provide the same trading signal. In often situations, these are technical indicators. However, they could also be combined with the following things:
- Price action
- Chart patterns
- Chart overlay tools
Confluence trading definition

Confluence trading represents the act of combining more than one single trading technique or analysis to increase your chances of winning trade once you use multiple trading indicators that provide the same “reading” as the best possible way of confirming the validity of a probable buy or sell signal.
It refers to any situation where you can see multiple trade signals that line up on the chart and signal you to take a trade. Confluence trading in forex is when multiple variables agree on the same basis.
In this context, “the same basis” refers to the direction of the market, which can be either upward or downward. Whole variables are techniques that make up the confluence trading.
A brief example of confluence trading
Suppose you use a single technical analysis tool that equals a 40% accuracy rate of predicting the correct price movement. You use a second on-correlated technical analysis tool to filter your decision more. You will increase your odds of earning profits in this way.
So, you will use the concept of confluence to find a trade setup using numerous technical analysis methods. Keep in mind that all of these autonomous forms of analysis signal a similar price movement.
This could happen once support and resistance levels are closely aligned with extension levels and Fibonacci retracement. What is also able to act as areas of interest are the following things:
- Psychological levels
- Dynamic support and resistance levels such as Bollinger Bands moving averages
- Previous highs and lows
So, once these levels accompany, they form more substantial resistance levels and support. It can all be used as: take profit levels or entry points.
Confluence trading with price action

In this context, price action means the price movement over a specific period. In other words, price action trading represents a trading method that allows a trader to read the market and create subjective trading decisions based on the actual and recent price movements, rather than just relying on technical indicators entirely.
Four Confluence trading price action techniques
The primary four levels or areas of confluence trading that could happen are the following ones:
- Resistance levels
- Support levels
- Fibonacci level
- Trendlines
In short, price action confluence trading is a technical analysis method of observing the prices in the foreign exchange market and trading it. To trade price action confluence, it is essential to possess the ability to spot the “merging” of price once resistance levels, support, trendlines, dibs, etc., all bring the price to a clashing point.
So, what about the most effective confluence trading strategies that every trader should be aware of?
The essential confluence trading strategies
Here are some of the most valuable confluence trading strategies that we recommend you consider for your trading purposes and goals:
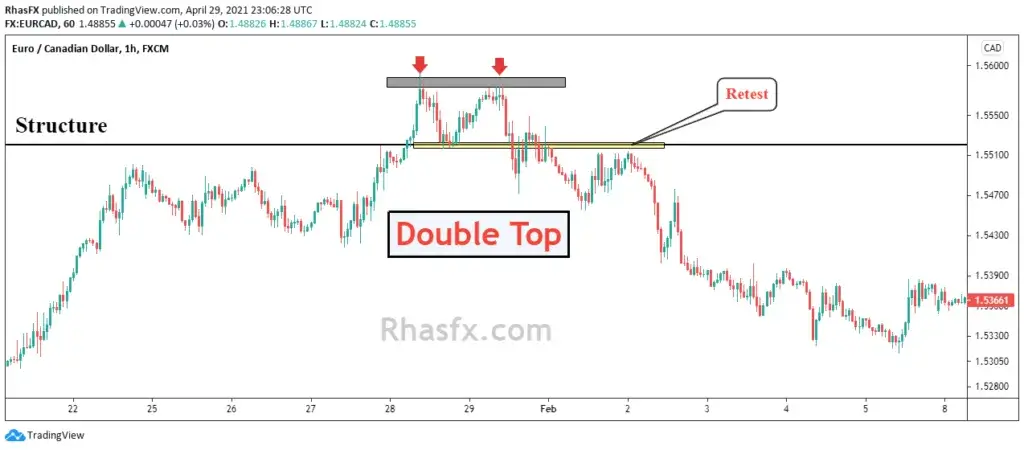
1. Market structure (support and resistance)
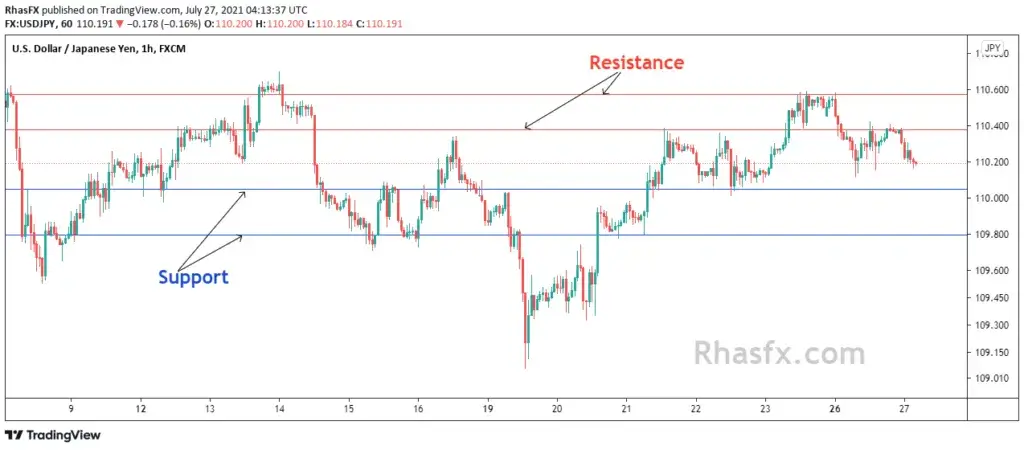 The market structure represents the collective reference to support and resistance. These areas within the market perform as a wall, particularly ceilings and floors, that attempt to prevent fluctuation of the price from going up and down.
2. Supply and demand zones
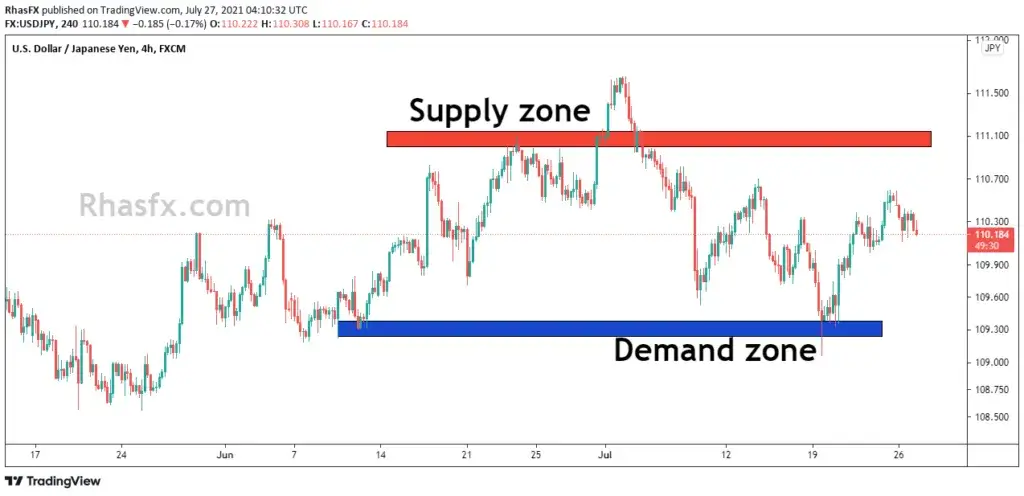 Another helpful example of a confluence trading variable is supply and demand zones. They are a more prominent form of resistance and support. It acts as a solid barrier to price. In most cases, we are talking about reversing and changing trends completely.
3. The direction of the secondary trend
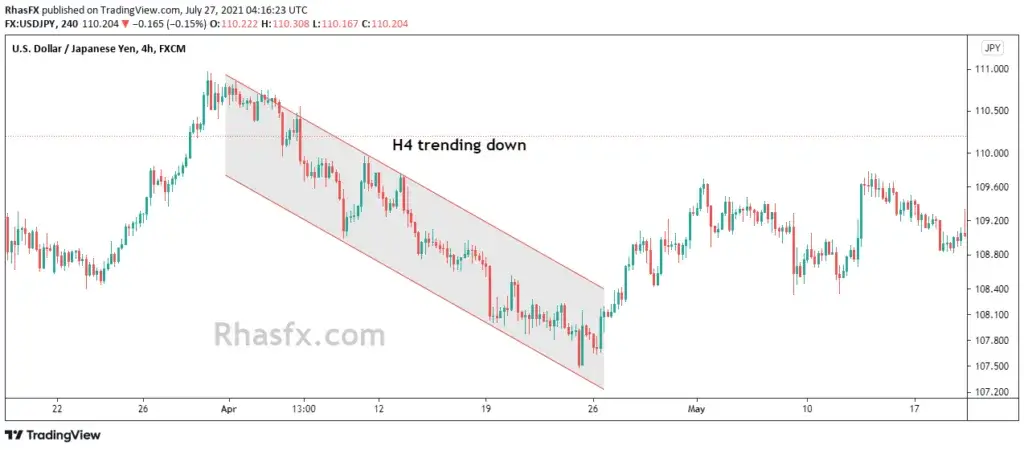 You can use the direction of the second-highest timeframe in your trading analysis. One of the main reasons for its importance to be included in your confluence trading is because
4. The direction of the primary trend
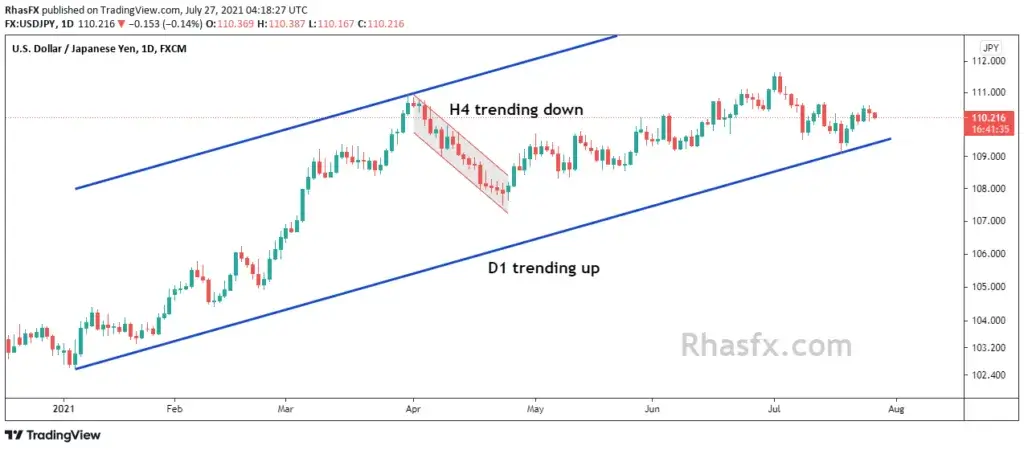 One of the most favourable variables for this type of trading is the direction of the primary trend. Previous track records indicate that trading in the daily trend direction could reduce losses by 40%. Please turn on the MT5 trade history and look at the daily trend direction to check it.
5. Price action patterns
 If you, a forex trader, know different price action patterns, it will allow you to predict and estimate a trend reversal. Do not forget that, in this case, we are talking about the crucial variable listed in the confluence trading list.
6. Candlestick patterns
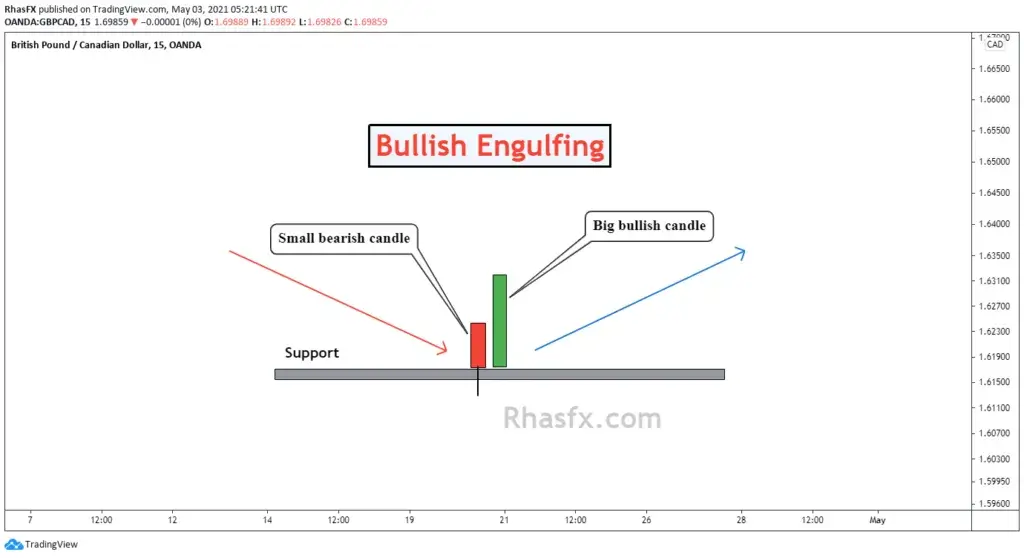 When it comes to candlestick patterns, it is essential to understand that they are essential as price action patterns or even more. If you understand what price is doing by knowing the fundamental philosophy behind the different candlesticks, you may get an edge against the market. Therefore, it is one of the essential techniques in a confluence trading strategy.
7. Trendline and moving averages
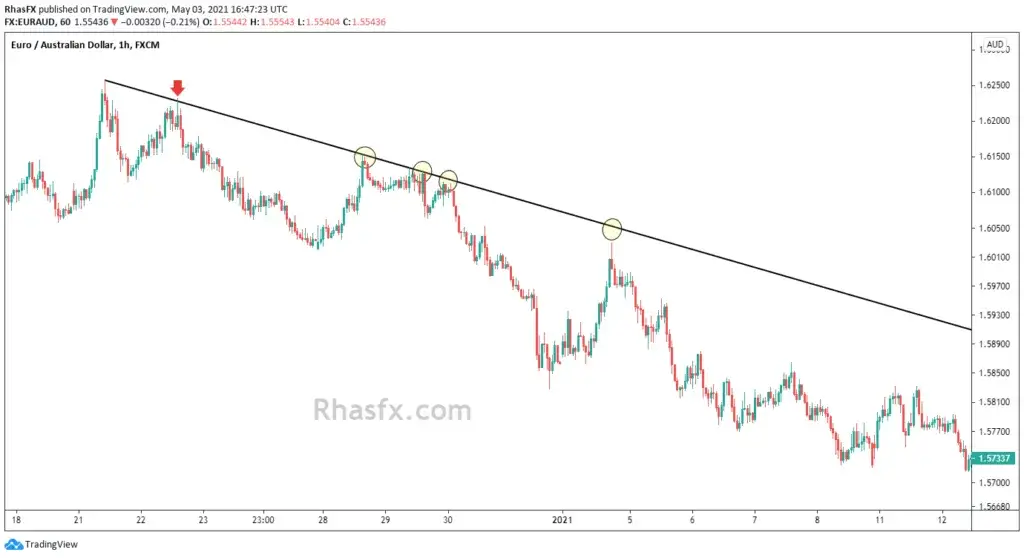 Trendline and moving averages are also defined as “market structure”. The reason for adding market structures to the list is the same for adding trendlines and, or moving averages.
Keep in mind that the primary reason for all this is basic market structures which are horizontal. Nonetheless, they are also able o be diagonal as a form of a trend line and dynamic in the mode of a moving average.
8. Fibonacci retracement price reversal zones
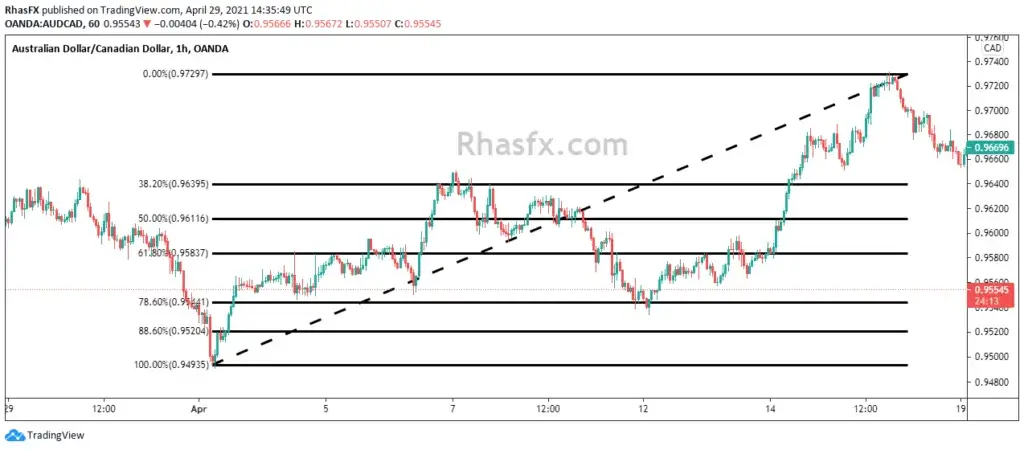 The Fibonacci retracements zones represent a crucial confluence of trading variables that traders should consider, especially once trading market structures 61.8%, 50%, and 38.2%.
9. Price rejection
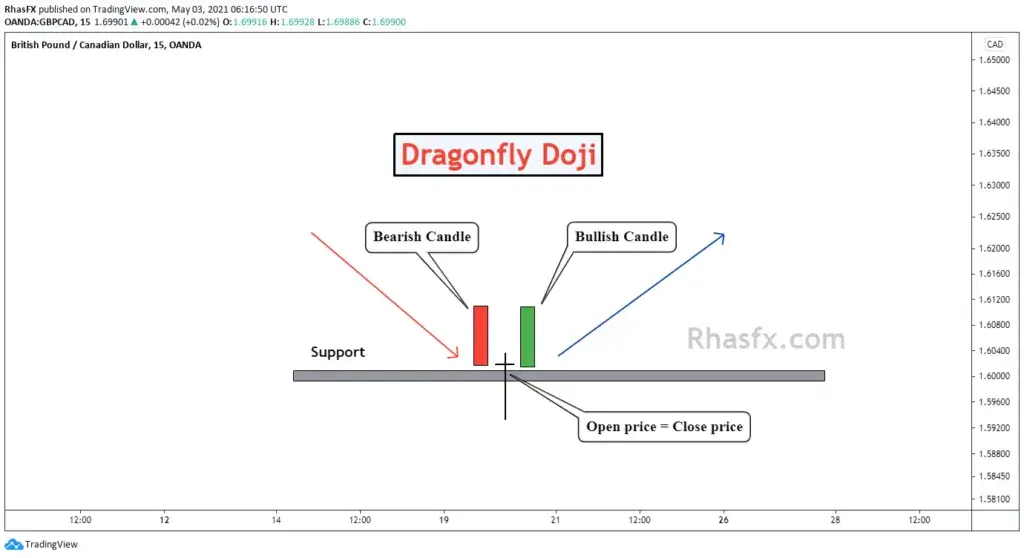 In this case, price rejection indicates that the market has a tough time breaking one specific structure. In this particular situation, the price will likely reverse from the structure, while the price rejection candlesticks all come in different forms. However, they are much similar to the form of a Doji.
10. Area of confluence
Last but not least important is the area of confluence trading. It’s where two or multiple structures are converged or cross each other. In that way, the area when these two cross each other in any time frame, making it much harder for the price to break that structure.
Indicators
Nevertheless, a confluence trading strategy list is completed with forex indicators in the mix. These indicators represent summarized graphical representations of past candlestick data. Traders mostly use these indicators to help them understand precisely what the market is doing.
How can you use confluence to place a good Forex trade?
Suppose you are using price patterns formed by the candlesticks on your chart, and then you get to see a pattern that signals a “buy” trade. Once the price pattern could be all that’s necessary to be right 80% of the time, you may have to find out that confirming the pattern, with additional confluence, can help you to be right 90% of the time.
The pattern might be all that you require to be right 80$ of the time. You may have discovered that confirming the pattern and confluence might help you be right 90% of the time. Also, if you have tested and found that Fibonacci retracement levels could help you in a proper context, you might expect the following:
If your price pattern signals “buy” aligns with the Fibonacci retracement level, it’s an excellent example of an “A” trade confirmed by confluence. It is not a so-called “cluttered Forex system” since there are no indicators drawn on the charts except the Fibonacci levels.
All you get to see are price patterns. You only overlay the indicator once you wish to check the proper context surrounding a price pattern. In case you do notice that the retracement level matches up with the pivot point you’ve kept your eye on, keep in mind that is another form of confluence and that there are other examples of numerous confluence examples that place a great Forex trade.