Moving Average Envelopes: How to Use?
Have you ever heard of the common term nowadays “moving average envelope”? If so, do you know what the most effective way to use it nowadays is? And ultimately, why are traders so obsessed with knowing everything regarding this topic?
First of all, before we get to know the moving average envelope explanation and examples, we’d like to explain to all beginners in trading, and even experienced ones, the true meaning of moving average. It is essential to understand it first to get a clear picture of moving average envelopes.
So, let’s begin with knowing and understanding moving averages!
What is the meaning of Moving Average?
In statistics, a Moving Average, also known by its abbreviation “MA”, refers to a calculation utilized to properly analyze data points by creating a series of averages of distinctive subsets of the entire data set. On the other hand, a moving average in finance represents a stock indicator that is frequently used in technical analysis.
Those who’ve just heard of the term “technical analysis” should know that it represents a trading discipline that is used to evaluate investments and identify trading opportunities by analyzing statistical trends.
So, a moving average is a trend-lagging or trend-following indicator based on past prices. It’s a simple technical analysis tool calculated to identify a stock’s trend direction and determine its resistance levels and support.
Why do traders calculate moving averages?
So, the main reason traders calculate the moving average of a stock is that they aim to help disentangle the price data by creating a continually updated average price. An average price is the asset’s or security’s mean price observed over time.
To correctly calculate a simple moving average, you should divide the number of prices within a period by the number of total periods.
Understanding a moving average better
Keep in mind that the longer the moving average period, the greater the leg. For example, a 200-day moving average will result in a much more significant lag than a 20-day Moving Average. It’s because it contains prices for the previous 200 days.
Traders and investors intensely follow both 50-day and 200-day moving average figures for stocks. They are considered crucial trading signals. As a resume, moving averages are mainly used to identify trend changes.
So, once you learn the fundamentals of moving average, it is time to learn all there is to know about the moving average envelope term and find its relevant explanation.
Moving averages Envelope – definition and explanation

A moving average envelope represents a technical analysis indicator that shows lines above and below the moving average. It is very similar to numerous other technical indicators such as Keltner channels and Bollinger bands, except that these two may vary the width of the channels or bands that are based on volatility measures.
The current price will usually be inside the envelope unless these envelopes are placed close to the moving average. Traders use the way moving average envelopes to influence their decisions for buying or selling may vary a lot. Generally speaking, moving averages envelops help traders to confirm trends and identify overbought and oversold conditions.
Some people say that a stock price crossing above the upper envelope represents a signal of strength, which means there’s a possibility for further signalling. On the other hand, other people think it can indicate the stock will be overbought, which is a sign of weakness.
What does the moving average envelope consist of?
A moving average envelope consists of a moving average and two additional lines. One particular line is above the moving average, while the other is below the moving average. Altogether, these two lines form a lower and upper envelope. A percentage specifies the distance between the moving average and the two envelopes.
It is called “envelope” because those lines envelop the original moving average line. The exponential N-period moving average is the starting point. It is calculated as the stock price average for each of the previous N periods.
How can you calculate a moving average envelope?
You should know that it is pretty simple to calculate moving average envelopes. First, it’s necessary to determine whether you’d like to use a simple moving average (SMA) or an exponential moving average (EMA).
Remember that EMAs include less lag since they put much more weight on recent prices. Afterwards, it is essential to select the exact number of periods you would like to apply. In the last phase, you need to set the percentage value you wish to use for the envelopes.
For instance, a 10-day moving average in correlation with a 1% envelope will demonstrate these lines:
- Upper Envelope: 10-day SMA + (10-day SMA x 0.1)
- 10-day SMA:
- Lower Envelope: 10-day SMA – (10-day SMA x 0.1)
Here you can observe the EUR/USD chart with a 10-day SMA and 1% envelopes. You will see how envelopes, shown as blue lines in the chart, move parallel with the orange line, representing the 10-day SMA.
How can you confirm the trend direction with MA Envelopes?

If you were wondering how are you able to confirm the trend direction along with the moving average envelope examples, it’s crucial to know and understand the following:
The moving average envelopes are used as a trend-following indicator because of the foundation of moving average envelopes a moving average.
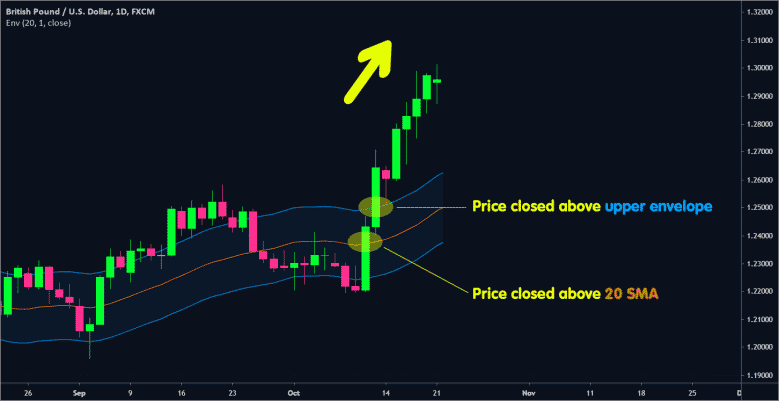
What determines the direction of these envelopes is the direction of the moving average. Once the envelopes are moving higher, the price is known to be in an uptrend. On the other side, when the envelopes are in the lower direction, the price is in a downtrend.
Remember that if envelopes are moving sideways, it’s evident that the price is neither in a downtrend nor uptrend. As a result, the trend is considered neutral, while the price is directionless. Pay attention to a situation where the price moves below or above the envelopes.
Bullish and bearish – explanation

In caste, the price surges above the upper envelope; it is considered bullish since trends in everyday situations start with a strong move. On the other hand, in case the price plunges just below the lower envelope, we can observe it as bearish.
Buy and sell signal – explanation.
Besides bullish and bearish examples, it is crucial to understand how to spot buy and sell signals. So, if the price closes above the upper envelope, it is a buy signal. On the other hand, if the prices close below the lower envelope, you should consider it as a sell signal.
Identification of Overbought and Oversold Levels

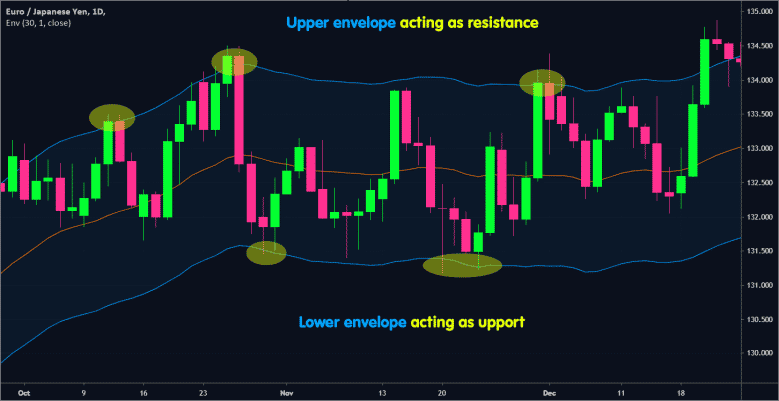
Suppose you aim to identify overbought and oversold levels with examples of moving average envelopes. In that case, it’s essential to know that there will come times once the price initially moves below or above an envelope but also goes back around. It happens once the moving average slop equals FLAT.
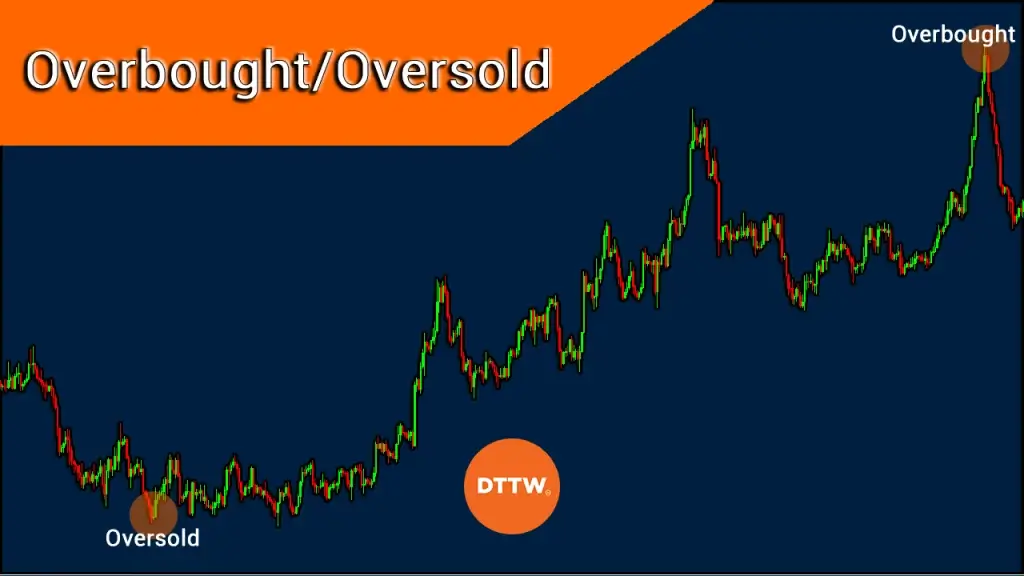
In this situation, moving average envelopes are able to be used for the identification of oversold and overbought levels. So, overbought levels are once the price moves above the upper envelope, while oversold is when the price moves below the lower envelope.
However, it is not relatively easy to identify oversold and overbought levels. For example, as you know by now, when the bullish trend is strong, a particular currency pair could become and remain overbought. Also, when the trend is bearish, something is technically oversold but remains oversold for quite some time.
Moving average VS Bollinger Bands strategy
A Bollinger Band is, most commonly, defined by a set of lines that are plotted two standard deviations, negatively and positively, far away from the simple moving average, known as the SMA, of the stock’s price. Keep in mind that you can adjust it to user preferences very quickly.
How to use moving average envelopes – summary
If you were thinking about the moving average envelopes strategy and how to use it in the proper way, always go back to the fact that the direction of the moving average determines the direction of the envelopes. If you think about the moving average strategy, the whole concept is pretty simple.
You need to take a few envelopes, write a particular expense category on every one of them, such as rent or student loans, groceries, etc., and then put the money you intend to spend on those things right into these envelopes. As usual, individuals have used the system of envelopes every month, using envelopes and actual cash.
How to read a moving average envelope indicator the best?
Also, you need to understand how to read a moving average envelope indicator. Here is the most simple guide to it:
- Enter a long position if the price closes below the lower envelope, and the %R demonstrates that it’s oversold, which means below -80.
- Please enter a short position in case the price closes above the upper envelope, and the %R shows that it’s above -20, meaning that it is overbought.
When it comes to a moving average envelope indicator mt4, it’s formed with two moving averages, one of which is shifted upward and the other one which is shifted downward.


