What is bullish kicking pattern?
In technical charts analysis of the financial markets, there is a wide range of candle patterns. These can indicate reversals, frequencies, volumes, etc. The bullish kicking pattern is a pattern indicating an upward trend reversal.
In Japanese, its name is Keri Ashi. It conveys an effect of total surprise and a violent counterpoint. The bullish kick is a very powerful pattern. The trend preceding the formation of the pattern is of little importance.
These candlesticks types will allow you to predict an upward reversal trend.
The trader needs to adapt the scale of an analysis to weekly, monthly or daily data. It depends on the time period he wants to study and whether it’s short or long term analysis.
This method is also well suited for investors willing to intervene in 10 to 30 minutes. Trdaers generally use this technique in short-term day tradings.
For a better interpretation, great importance should be given to the size of the bodies and shadows of the candles forming the candlestick pattern.
For example, a candle with a relatively large body will indicate significant pressure.
The pressures will be all the more marked as the shadows will be small.
It will be preferable to observe large candlesticks with small shadows to stay in the movement and not in the opposite direction.
Finally, a movement must always be accompanied by significant transaction volumes.
This figure gives excellent input signals.
How to interpret the bullish kicking pattern?
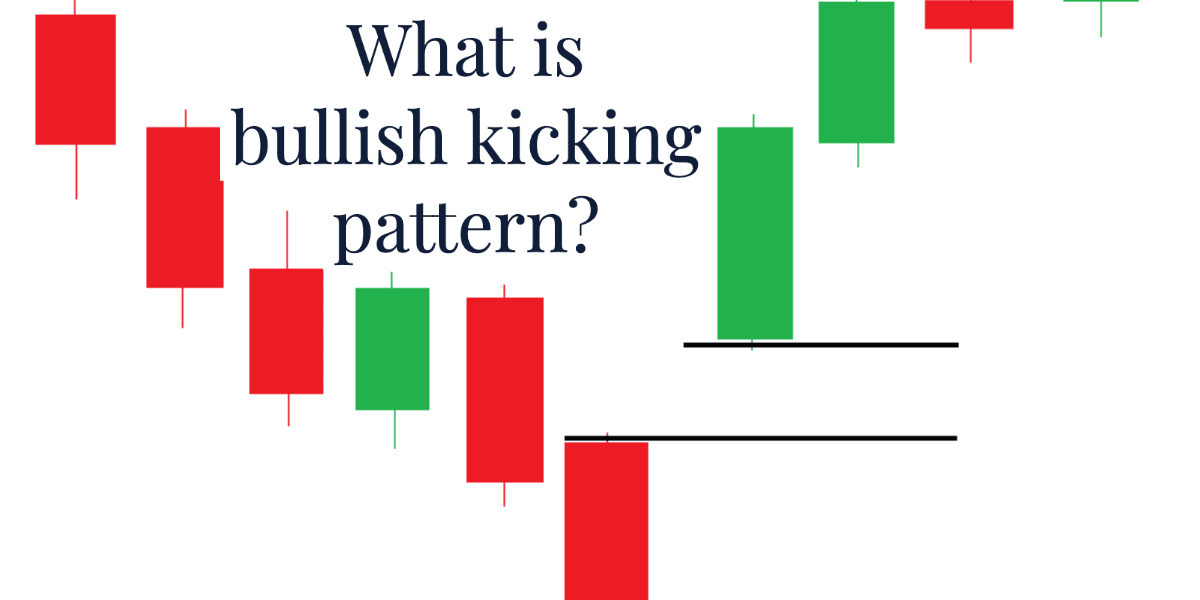
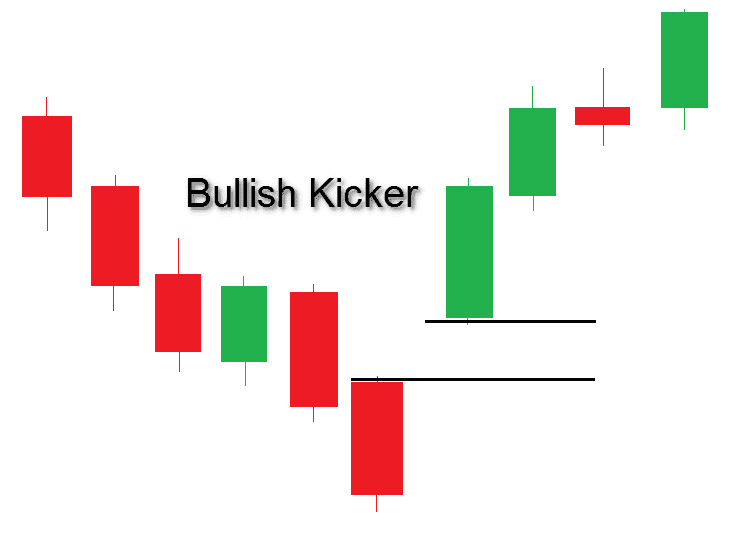
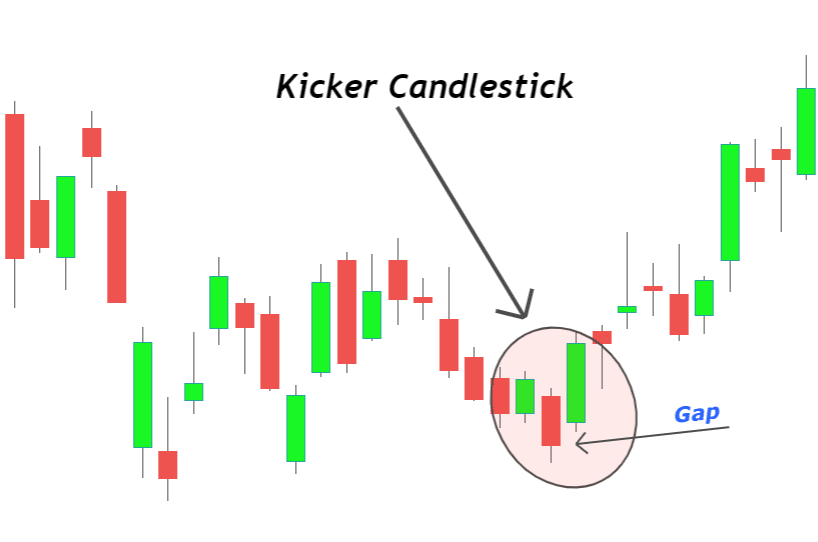
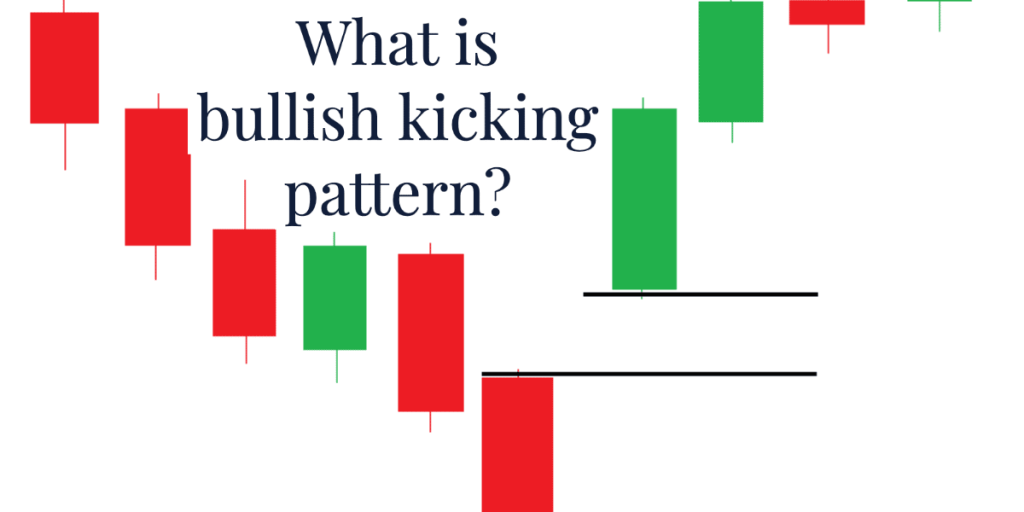
The “bullish kicker” candlestick structure is formed by a first red marubozu candle followed by a second green marubozu candlestick which opens in a bullish gap.
The “bullish kicker” candlestick pattern appears after a long downtrend and in a bear-controlled market.
This structure is a bullish candle. It gives a strong sign that bulls lead the market.
Generally, the market’s direction doesn’t matter much, unlike most other candle patterns. As such, a pattern occurs and works identically in a bullish or bearish market.
The “bullish kicker” candlestick structure must consist of two candlesticks without shadows. Otherwise, the shadows must be very small. These patterns are similar to marubozu.
How to validate a Japanese bullish kicking pattern?
The reliability of this candlestick pattern is low. However, to validate the pattern of the Japanese candlestick “bullish kick,” a structure confirmation is necessary on the third day.
The upward trend needs to be validated by a bullish gap, a green candlestick, or a rise in prices the following trading day.
Validation of the “bullish kicking” pattern is necessary for the trend reversal to materialize.

How to use volumes with the bullish kicker candlestick?
As in all patterns based on Japanese figures, the prediction of the stock market prices’ evolution will have to be validated by the following session.
The realization of the figure “The bullish kick” is all the more reliable if large volumes accompany it.
Important: Traders believe that a price trend or reversal has more predictive power if traded with high volumes.
For example, in the context of our Japanese candlestick, a figure with a large distance between the opening price and the closing price accompanied by high volume indicates a high probability of realizing the trend anticipated by our candle.
Candlestick charting – Graphical representation of the bullish kicking pattern
Depending on the representations used, a candlestick in a bull market will be represented with a white marubozu or green marubozu.
Conversely, a Japanese candlestick will be represented in a bear market by a black marubozu or red marubozu.
You can see a bullish kicker from the MT4 and MT5 trading software. It is also possible to import or develop a programmable script to detect the pattern.
The bullish kicking pattern is suitable for any investment horizon, whether scalping over a very short period of trading or over a larger unit of time. It all depends on your investor profile.
For example, for a long-term investment, it will be preferable to use an appropriate time unit – a week or a month. On the contrary, for a short-term investment, a periodicity of one hour or days will be perfect.
Bullish Kicking Pattern Definition and quick overview

Definition: The bullish kick is a pattern formed by two Japanese candlesticks. The first is a bearish marubozu (red) followed by a bullish marubozu (green) which opens on a large bullish gap. The open price of the second candlestick must be higher than the open price of the first candlestick.
Characteristic: The bullish kick often forms after a significant decline characterized by several large red Japanese candlesticks.
Meaning: The bullish kick is a pattern indicating an upward trend reversal. It conveys an effect of total surprise and a violent counterpoint.
The bullish kick is a very powerful pattern. The trend preceding the formation of the pattern is of little importance.
Invalidation: The bullish kicker is invalid if the next candlestick is not bullish or does not open a new bullish gap.
Is Bullish Kicking Pattern a Reliable Indicator?
You can always be somewhat certain about the reliability of a candlestick pattern, the bullish kick. As with the other patterns in technical analysis, however, it is possible to identify the best patterns and significantly improve your results and success rate by backtesting trading with the bullish kick chart.
To make the most out of your technical analysis, you must combine several reversal indicators’ results. According to statistics, a bullish kicker acts as a bullish reversal 53 percent of the time. It’s pretty random, so don’t try to guess the direction of the breakout using just this candlestick pattern.
Reversal patterns combined with the bullish kicking pattern
Here are some indicators that traders usually use in combination with a bullish kicking pattern to better predict reversals on the market.
Wedges
The wedge is similar to a symmetrical triangle inclined upwards (ascending wedge or “rising wedge”) or downwards (falling wedge or “falling wedge”).
Despite their resemblance to triangles, they are totally different because the bevel is at the end of the trend and suggests a change in the latter.
V-bottom and V-top

This is a powerful reversal setup that marks a sharp shift in consensus.
The “V” bottom occurs at the end of a downtrend. The first part of the V is marked by a strong acceleration of the downtrend leading to a sell-off (final panic selling). On the lowest, we are witnessing a sharp rise in prices and a strong comeback of buyers. The “V” top is the reverse configuration. It marks the end of an uptrend.
Unlike the rounding bottom, which is characterized by a gradual change in psychology, the V top or bottom evokes a situation of panic or euphoria. This is why the breakout is generally violent and accompanied by strong volumes.
Once the configuration has been validated, a price objective can be set by reporting the height of the V at the breaking point.
Head and shoulders
The head and shoulders candlestick pattern is a major reversal pattern, one of the best known in chartist circles (but also infrequent). It owes its name to its particular shape, representing a head and two shoulders.
This figure is born after a long upward trend and is formed of a series of three consecutive peaks, the first and the third being of almost similar height, while the second is relatively higher.
A several tips for getting the most out of chart patterns
Technical analysis is full of many indicators that you need help finding your way around. Fortunately, you can only know some of them to invest better in the stock market.
Nevertheless, you need to know the basics. To do this, focus on technical elements that seem easy to understand.
You will be excited to know that some technical setups have near 80% predictability, which is an argument that does not leave you insensitive.
But their main asset is to gain insight into the behavior of investors. Thus, on your graphic screens, you can spy on their actions. This is how to be on an equal footing with the majority of professional investors.
You can see for yourself that chart patterns are formidable weapons of technical analysis. They offer technical signals on the reliability of the trend of the action or not.
Let’s be honest. A few will be challenging to spot on your screens at a glance. To familiarize yourself with these chart setups, you would be eating the chart for many hours. Of course, we don’t ask you to sacrifice your weekends every week.
Finally, here is a summary to exploit their full potential:
Wait for one or two more candles to validate the exit of the chartist figure from above or below.
Refrain from relying too much on statistics, even if they are proven to help you make investment decisions.
Keep in mind that there are no perfect chart patterns. Refrain from seeking absolute perfection in drawing them because you risk creating uncertainty in your own technical analysis.
It would be a shame to ignore its chart figures because of their significant predictive power.


