Spinning Top Candlestick Pattern – Get All The Basics
Have you ever wondered in trading what exactly Spinning Top Candlestick represents? Why are more and more traders around the world interested in this, and why is this candlestick pattern crucial for more successful results?
First of all, the Spinning Top Candlestick pattern has become very popular recently thanks to its great help to traders to find certain information in the market as effectively as possible and achieve better success.
If you are interested in the spinning top candlestick pattern meaning, what it really is, and how useful it is not only in Forex trading but also in other markets, let’s find out by giving a detailed definition and explanation of all the basics, shall we?
Definition of Spinning Top Candlestick Pattern
Spinning Top Candlestick refers to a specific candlestick pattern representing indecision about the assets’ direction in the days to come. In other words, it represents a situation in which both sellers and buyers are able to gain the upper hand. This formation signals indecision with the following trend direction.
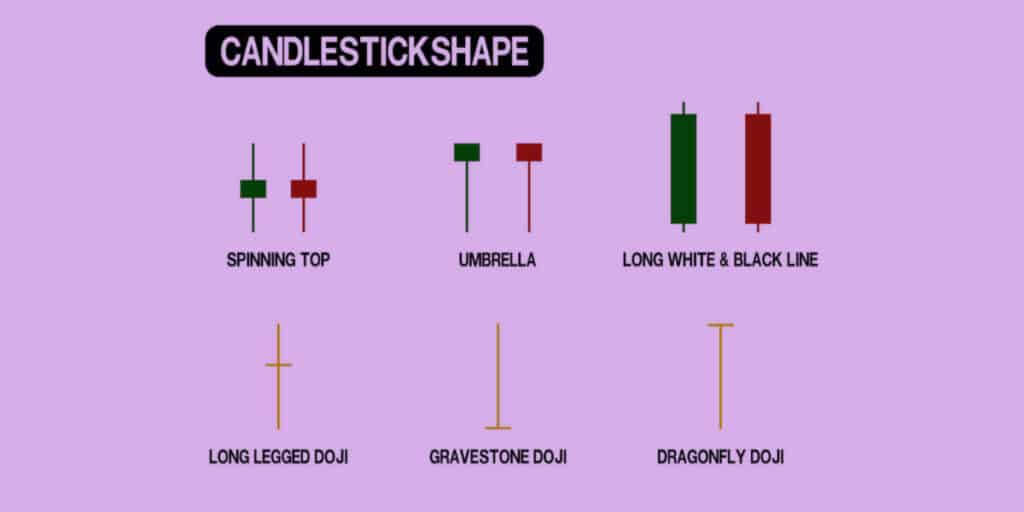
It includes a real short body focused vertically in the middle of long lower and upper shadows. The real body should be small in this case, indicating the main difference between close and open prices.
The Spinning Top Candlestick pattern is formed once buyers force the price higher in the course of a specific period and sellers force it down in the meantime. Nonetheless, the closing price ends very near the opening price.
Spinning tops signal a likely price reversal.
Once the strong price declines or advances, spinning tops could signal a probable price reversal. That’s a potential situation in which the candle that accompanies confirms. Even though the two prices stick together in all situations, a spinning top includes close below and above the open.
So, since both buyers and sellers push the price without the ability to keep it, the Spinning Top Candlestick pattern manifests that numerous sideways movements are able to follow. It also expresses indecision.
What does the Spinning Top Candlestick Pattern show?
As mentioned above, the Spinning Top Candlestick pattern includes the spinning tops representing an asset’s indecision. In this case, both long upper and lower shadows specify there are no price changes in the middle of the open one and the close one.
There are two terms that you need to be aware of regarding the Spinning Top Candlestick pattern:
- Bulls – they send the price intensely higher
- Bears – they send the price intensely lower, where in the end, the price closes near where it was open.
In this example, we see indecision, which signals more sideways movement. It’s especially in case the spinning top happens in a chronic range. In addition to that, this could also be an indicator of a probable price reversal if the price declines or advances.
Signaling a notable trend change
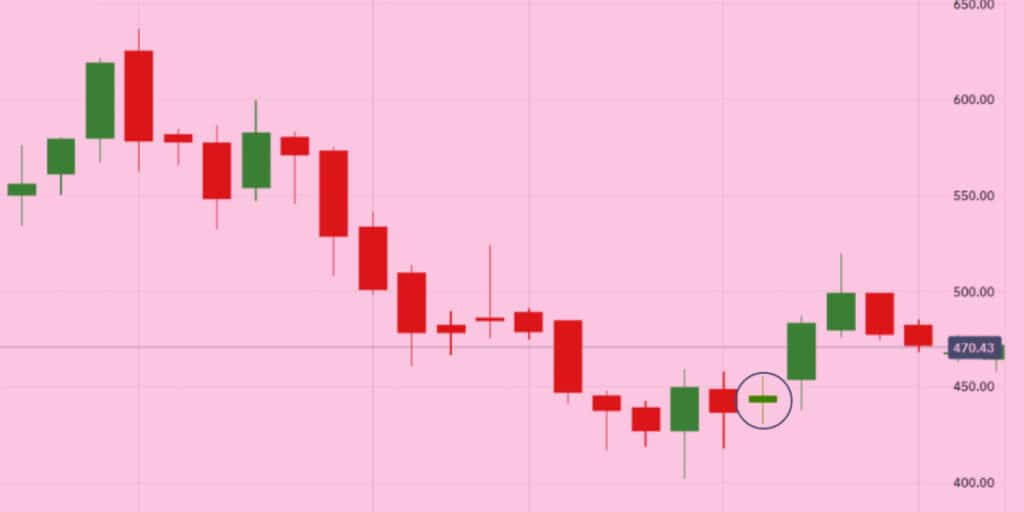
There are some situations where spinning tops could signal a notable trend change. The bulls lose control, and the trend reversal happens as a result of the spinning top occurring at the top of an uptrend.
In the same fashion, a spinning top at the bottom of the downtrend usually prompts that bears no longer have their control, leaving it all to the bulls. With the right confirmation, traders could easily understand what the spinning top indicates.
The confirmation and the spinning top
It’s crucial to understand regarding the Spinning Top Candlestick that the confirmation results from the following candle. In case a trader believes a spinning top right following an uptrend is able to lead to a reversal to the drawback, the candle next to the spinning top could witness a drop in prices.
On the contrary, the reversal still needs to be confirmed, so traders have to wait for another valid trade signal. Remember that when the range continues, and indecision is still widespread, it’s a sign that a spinning top is happening within a range. The following candle should confirm, i.e., staying within the formed sideways channel.
Doji and spinning top candlestick pattern – what do you need to know?
Suppose you were wondering what the difference and similarities between the Doji and spinning top candlestick patterns are. In that case, it’s crucial to understand that both dojis and spinning tops represent indecision. However, in the Doji pattern, dogs are smaller. They have small lower and upper shadows and small real bodies in general.
Both Doji and spinning top candlestick patterns happen frequently. In some cases, they’re both used to alert the reversal after a solid price move. Also, both of these patterns depend on confirmation. Remember that a strong move after the Doji or the forex candlestick patterns spinning top shows a new potential price direction.
However, what is the main difference between the Spinning Top and Doji patterns?
The main difference between a Doji and a top-spinning candlestick
Both patterns are part of much larger patterns, like star formations. Each pattern indicates equality in buying and selling pressures and neutrality in price. However, there are differences between Doji and spinning top candlesticks, especially in how numerous professional tech analysts interpret them.
Regarding Doji candles, they look like a plus sign or a cross. It heavily depends on the shadows’ length. The main doji’s trait is a very narrow body, so open and close prices are nearly identical. The length of this candle’s lower and upper shadows determines the day’s high and low.
Once it is observed gapped above the past hollow candle, it shows a reversal in buying momentum. On the other hand, in case a Doji appears beneath a filled candle, it shows a downward trend reversal.
How are Spinning tops different?
Spinning tops, even though they’re similar, have larger bodies where the close and the open are very near each other. The biggest difference in the middle of these patterns is that a spinning top, without exception, has longer legs on all sides. It shows a huge variance in the low and high.
Besides that, the spinning top shows the current trend weakness. However, it’s not exactly a reversal. If traders pot a spinning top, they should find other indicators to decide the context and see if they’re indicative of trend reversal or neutrality.
One of these indicators is Bollinger Bands, a technical analyst’s tool defined by a trendiness set plotting two deviation standards both positively and negatively away from the SMA, the simple moving average’s security price. However, they could be set to users’ preferences.
How to recognize a bullish spinning top candlestick pattern?
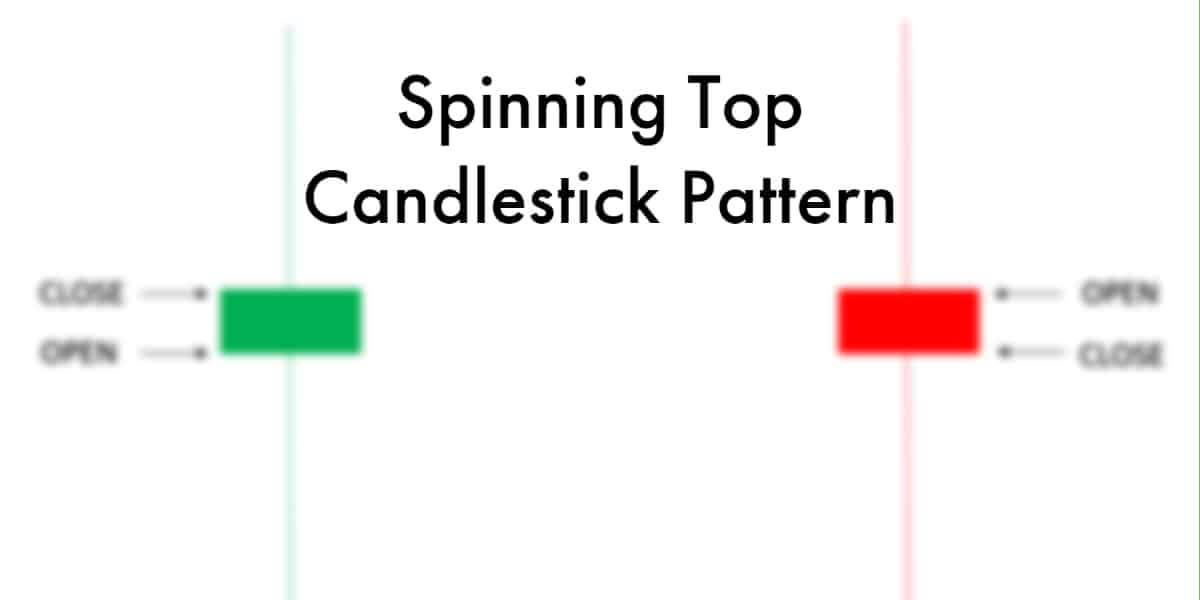
It’s crucial to know that there are two variations of the Spinning Top Candlestick pattern:
- The bullish spinning top candlestick that’s green in color
- The bearish spinning top is red.
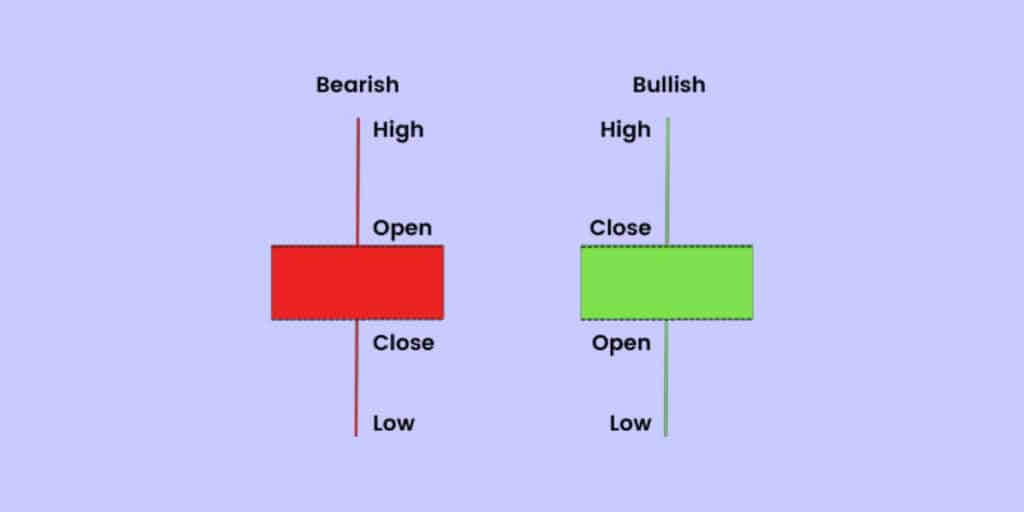
The bullish spinning top candlestick happens once the closing price exceeds the opening price. On the other hand, the bearish spinning top candlestick pattern happens once the opening price is much higher than the closing price.
The black spinning top candlestick pattern and the candlestick double spinning top pattern
The black spinning top candlestick pattern occurs once the downward price trend. However, the breakout upward. In this case, the pattern is a reversal. The breakout happens once the price closes below or above the top bottom of the candlestick.
On the other hand, the candlestick double-spinning top pattern refers to a continuation of the previous trend.
How to trade the spinning top candlestick pattern?
Traders can choose some of the few possible ways of trading when the spinning top candlestick pattern occurs. The primary step is the confirmation of the signal. The majority of professional traders utilize technical indicators that confirm that they believe that the signalization of the spinning top is occurring.
Due to these indicators, they’re able to have more information and insight into the price trends. For instance, if a trader is convinced that the spinning top of the downtrend’s bottom can indicate the upcoming reversal, a trader can test the signal with the stochastic oscillator.
In this manner, traders could predict all the price movements since they show the market’s momentum and speed in a particular timeframe. Traders could go long (buy) in the case of the upcoming reversal confirmation. You can utilize derivatives like CFDs or spread bets if they want to trade when they spot the spinning top candlestick pattern.
Keep in mind that traders don’t own underlying assets with derivatives. They’re speculating on their price movements. It means that traders could trade falling and rising markets in order to take action after bearish and bullish spinning tops.
Simple steps for trading when the spinning top candlestick pattern occurs are:
- Create your trading account or log in to the existing ones
- Enter the right position size for yours
- Pick on the deal ticket either the “buy” or “sell” option
- Confirm the trade in the end.
Keep in mind that with this type of forex spinning candlestick pattern, you can practice trading with a proper demo account where you can open and close positions risk-free.
Key Takeaways
- The Spinning Top Candlestick refers to a formation that shows indecision with the succeeding trend direction.
- It is very similar to the Doji candlestick pattern.
- A spinning top in this candlestick is known as a neutral pattern, even though numerous of them end in reversed positions.
