AUDUSD and AUDNZD: AUDUSD continues to slide lower
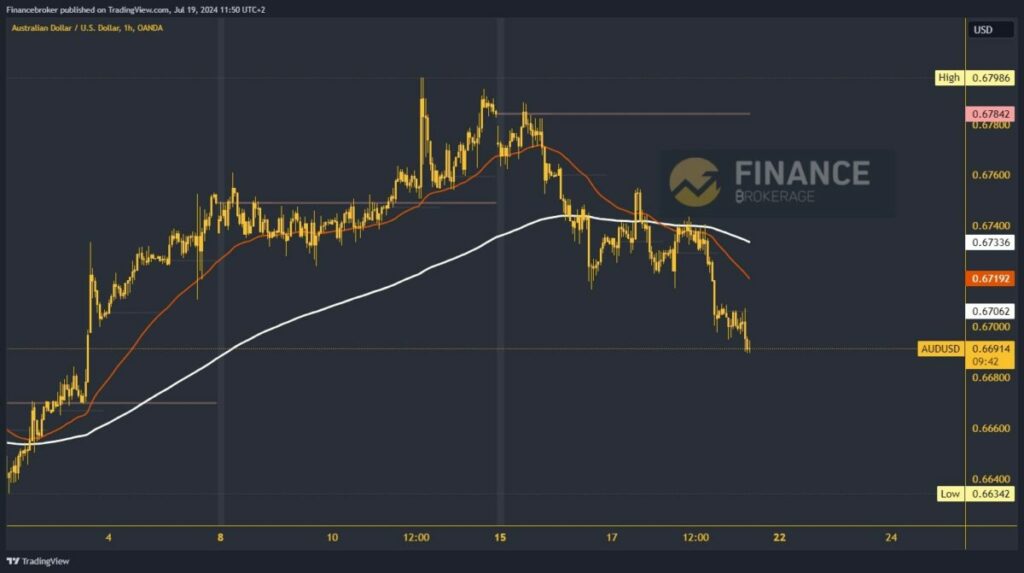
- This week, we are looking at a pullback in the AUDUSD from 0,67842.
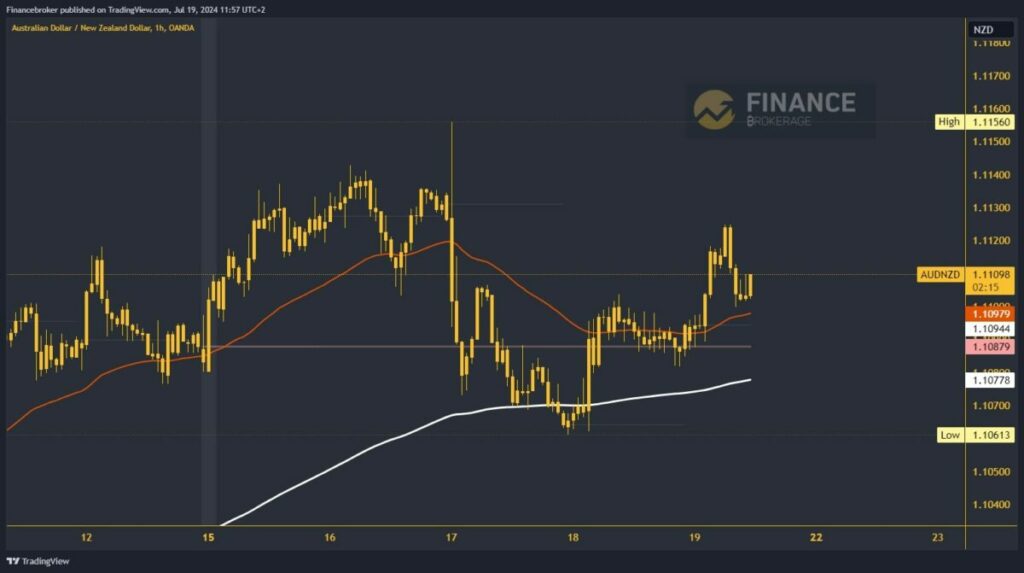
- Yesterday, AUDNZD retreated to the 1.10600 level, forming a weekly low.
AUDUSD chart analysis
This week, we are looking at a pullback in the AUDUSD from 0,67842. During this morning’s Asian trading session, the pair lost support at the 0.67000 level and saw a break below. A new weekly low was formed at the 0.66900 level. There is a high chance that we will continue until the end of the day with a pullback to a new low. Yesterday, the pair encountered strong resistance at the 0.67400 level, and we had additional pressure in the EMA 200 and EMA 50 moving averages.
Potential lower targets are the 0.66800 and 0.66600 levels. We need a positive consolidation and a return above the 0.67000 level for a bullish option. Then, we need to maintain and stabilize there. After that, the AUDUSD will be well positioned to initiate a bullish consolidation. Potential higher targets are the 0.67200 and 0.67400 levels. The first additional resistance is the EMA 50 in the zone of 0.67200 levels.
AUDNZD chart analysis
Yesterday, AUDNZD retreated to the 1.10600 level, forming a weekly low. After the new support, we started a positive consolidation from that level up to the 1.11000 level. During this morning’s Asian trading session, the pair continued a bullish consolidation and rose to 1.11248 levels. We have the support of the EMA 50 moving average at 1.11000 and believe that the pair could continue to the bullish side.
Potential higher targets are the 1.11400 and 1.11600 levels. For a bearish option, we need a negative consolidation and a move down to the 1.10800 level. There, we will test the EMA 200 moving average and the weekly open price. With the impulse below, we go to a new daily low and thus confirm the bearish scenario. Potential lower targets are the 1.10600 and 1.10400 levels.


