Oil and natural gas: oil in a new surge since yesterday
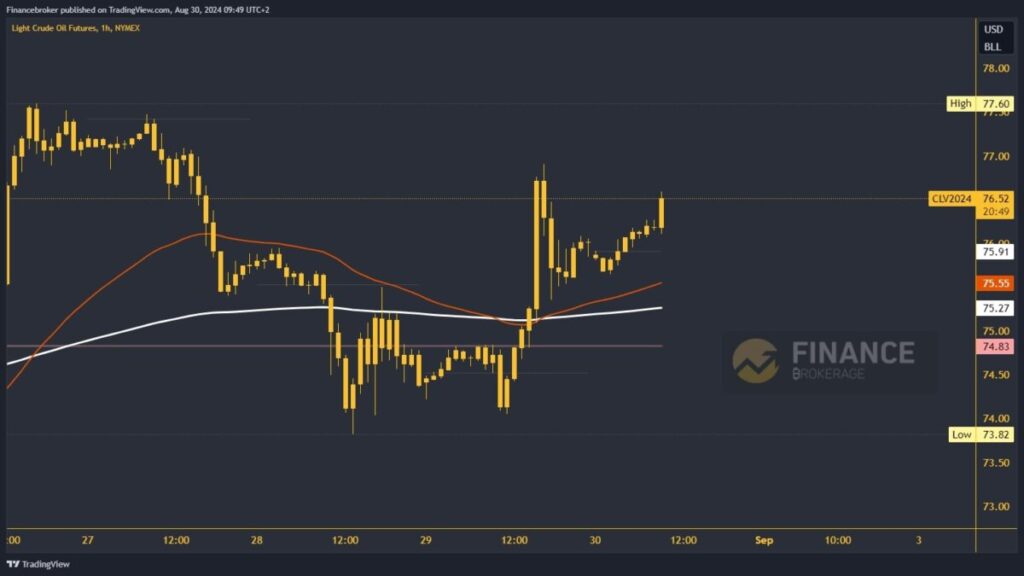
- During this morning’s Asian trading session, the price of oil gained support at the $76.00 level
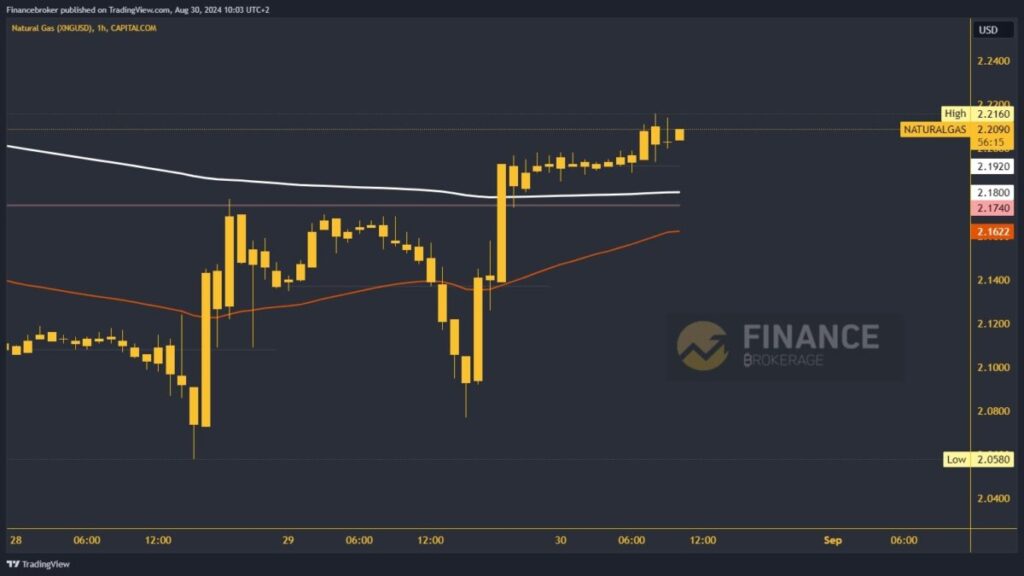
- Yesterday’s pullback in the price of natural gas was up to the $2.07 level
Oil chart analysis
During this morning’s Asian trading session, the price of oil gained support at the $76.00 level. After that, we saw the initiation of bullish consolidation and price growth to the $76.50 level. Oil is on a bullish run, and we expect to test yesterday’s high at $77.00. If we manage to reach that level, the chances of us continuing with the further bullish trend increase.
Potential higher targets are the $77.50 and $78.00 levels. For a bearish option, we need a negative consolidation and a pullback of the oil price below the daily open price. This moves us to the bearish side, where the bearish pressure strengthens. After that, we expect to see a further pullback and drop to a new daily low. Potential lower targets are the $75.00 and $74.50 levels. In the $75.25 zone, we expect support in the EMA 200 moving average.
Natural gas chart analysis
Yesterday’s pullback in the price of natural gas was up to the $2.07 level. After the new support, the price quickly stabilized and initiated a bullish consolidation back to $2.19 and above the EMA 200 moving average. During this morning’s Asian trading session, natural gas successfully held above the $2.19 level. This led us to climb to $2.21 and form a new daily high there. If today’s trend continues, we can expect to climb to a new high.
Potential higher targets are the $2.20 and $2.22 levels. For a bearish option, we need a negative consolidation of the natural gas price and a pullback below the $2.18 level. This will cause us to fall below the EMA 200 moving average, significantly increasing the pressure on the price to go into a deeper pullback. Potential lower targets are the $2.16 and $2.14 levels.


