Gold chart overview
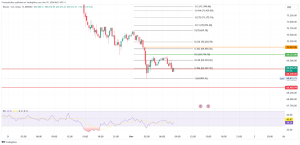
The price of gold stopped on Thursday in its May campaign against high targets. Gold stood at $ 1909 and failed to form a new higher high and surpass the previous high of April 29 at the $ 1920 level. The dollar continued to strengthen, and such a scenario negatively affected the price of gold. Price was forced to retest and seek support in the $ 1850-1855 zone. Our following lower targets are first a $ 1,850 low from May 3, then a $ 1,844 low from March. We need a new positive consolidation and escape above the critical zone for a potential bullish option. At the top, we have a smaller trend line, and we need a break above it to form technical support to continue the bullish trend. The first bullish target is the previous lower high at $ 1885, then the $ 1892 level high from last Friday, and the $ 1909 May high.
Silver chart overview
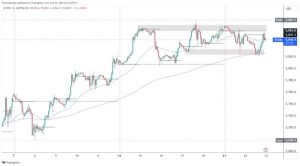
The price of silver has lost 2.5% of its value today. The initial value at the stock exchange opening was $ 22.36, and now it is $ 21.73. The May minimum is still forming, and the previous one was 22.12 dollars. The price tried to switch to the bullish trend on Thursday but without success. The trend was reversed quickly on the same day, and the price was withdrawn to the starting position before the jump. Friday was a day for consolidation without major oscillations, and today the April pullback continued. From the upper side, we can draw a line that could indicate a future trend, and the break above could change the view of the next price movement. The critical zone is 22.30-22.50, and a break above could slow down the price drop and form a stable bottom on the chart. We would characterise such a picture as positive for the price of silver, from which a new bullish trend would emerge.


