EUR/AUD analysis for April 29, 2021
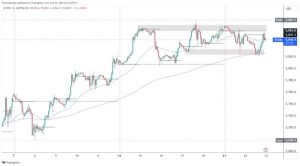
Looking at the chart on the four-hour time frame, we see that we are moving in one ascending channel. We can notice that the EUR/AUD pair is currently consolidating slightly above the channel’s bottom line, with the support of moving averages, and the MA200 and EMA200 give excellent support. Based on this condition on the chart, we can expect the trend to rise to the upper edge of the channel.
Our first next bullish target maybe the previous high at 1.56750, and with the help of good consolidation, maybe 1.57500. Looking at the MACD indicator, we see that we are in a bullish trend, but based on the strength of previous histograms, this trend is not too strong and has many weaknesses.
On the daily time frame, we see that the EUR/AUD pair is making a turn to the bullish side with the support of moving averages MA20, EMA20, and MA50. If we look at it that way, then we can expect a continuation towards the running averages of the MA200 and EMA200. Such a broad picture tells us that we are in a big bearish trend and that this is just a pullback. To continue the bearish trend, we need a break below the lower moving averages to continue down unhindered, aiming at the previous low at 1.52500. Looking at the MACD indicator, we see that we are in a slightly bullish trend for now, but it can very easily happen to reverse the trend and return to the bearish scenario.
We see that the EUR/AUD pair, after making a new low, bounces on the weekly time frame, making a pullback to the moving averages MA20 and EMA20. The break above them leads us to MA200 and EMA200 at 61.8% Fibonacci level at 1.60000, and if we see a decline from MA20 and EMA20, we go back down first to test the previous low at 1.52500 and looking at the next potential support at 78.6% Fibonacci level at 1.5000. Looking at the MACD indicator, we are at the beginning of the bullish trend, which coincides with this pullback.
- Dogecoin analysis for April 29, 2021


