EUR/USD analysis for April 12, 2021
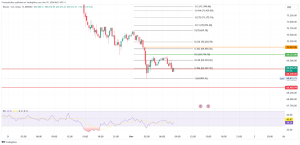
The chart on the four-hour time frame shows that the EUR/USD pair is currently testing the MA200 and EMA200 at 38.2% Fibonacci level at 1.19000. Since the beginning of April, the EUR/USD pair has been in a bullish trend from the previous low to 1.17000. after that, the EUR/USD pair finds support in moving averages MA20, EMA20, and MA50 with a break made above 23.6% Fibonacci levels. If the bullish momentum continues, we can expect a jump above 38.2% and all moving averages.
We are looking at the previous high at 1.19500. Our technical bullish target is 50.0% Fibonacci level at 1.19700. The MACD indicator is still on the bearish side; we need at least one green histogram as a potential confirmation for its stronger bullish signal.

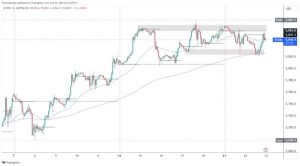
On the daily time frame, we see the EUR/USD pair testing moving averages and looking for support in the MA200 and EMA200. The movement is within a smaller descending channel and based on the state on the chart, and we can expect a pullback to the upper edge of the channel above 1.20000. We see the MACD indicator that the blue MACD line made a break above the signal line. And on this daily time frame, we have a bullish signal of the MACD indicator. If we look at the bearish sequel, we need a break below 1.18000, and then we look towards 1.11600.
- Gold fell driven amid rising U.S. Treasury yields
 On the weekly time frame, we see that with the finding of support at 1.17000, it declines to the current 1.19000 testings the MA20 and EMA20 while at the bottom is the support of the MA50 and MA200 and EMA20. The raw image is bullish, and we can only look at this as a pullback to better support it. Following the MACD indicator, we see that the blue MACD line slows down and moves sideways with the probability of turning up and crossing the signal line. And as additional support, we have the last two red histograms that speak of the bearish trend’s weakening.