EURUSD and GBPUSD: Charts stagnate at the end of the year
- Pair EURUSD continues its sideways movement today in the range of 1.06000-1.06800.
- During the Asian trading session, GBPUSD moved to the 1.20000 support zone.
EURUSD chart analysis
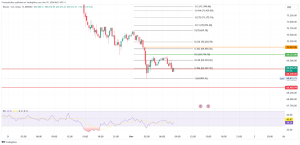
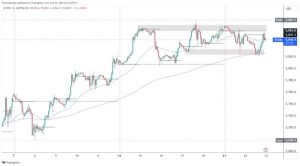
Pair EURUSD continues its sideways movement today in the range of 1.06000-1.06800. We did not see any more specific movement in the last seven days on the chart that could change the movement of the current trend.
We will probably see a little market volatility today and tomorrow. From the middle of December until today, the EURUSD pair has been moving sideways. On the upper side, we have the resistance zone 1.06500-1.06800, while on the lower side, we have the support zone 1.05750-1.06000.
GBPUSD chart analysis
During the Asian trading session, GBPUSD moved to the 1.20000 support zone. We can say that we have increased pressure at that level and have been staying around that level for a long time. If we fail to move up with some bullish impulse, we could expect a breakout below and the formation of a new December low. Potential lower targets are 1.19500 and 1.19000 levels.
For a bullish option, we need to climb up to the 1.21000 resistance level and try to move above. This is the only way we could start a new bullish recovery.


