EURUSD, GBPUSD and USDRUB chart overview
EURUSD chart analysis
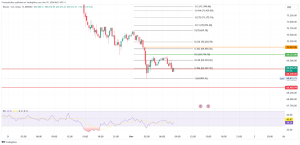
During the Asian session, the euro weakened against the dollar. Earlier this week, European Central Bank President Christine Lagarde said that eurozone monetary policy would not keep pace with US Federal Reserve policy. The conflict in Ukraine and the repercussions of harsh sanctions against Russia have very different consequences for the economies of the United States and Europe. A NATO meeting is being held today, at which a new set of sanctions against Russia will be discussed, primarily in terms of the embargo on oil and gas imports. The euro is currently exchanged for 1.09800 dollars, which is a weakening of the common European currency by 0.19% since the beginning of trading tonight. We are in a bearish trend after EURUSD encountered an obstacle at the 1.11000 level. Pair is already on its fifth day in a downward trajectory, and we are now testing a 1,10000 level in search of potential support. The previous support was at 1.09000 from March 14, and we are very close to this year’s minimum at 1.08000. For the bullish option, we need new positive consolidation and growth above 1.11500. After that, our target is 1.12000 level, and the additional resistance at that level is our MA50 moving average.
GBPUSD chart analysis
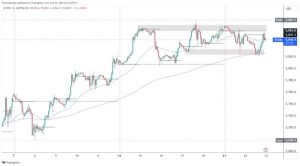
Rising inflation threatens the economic growth of the British economy. The pound is exchanged for $ 1.32010, representing a recovery of the British currency by 0.01% from the beginning of trading tonight. We continue the ten-day recovery after GBPUSD found support at the 1.30000 psychological level for banks and investors. To continue this short bullish option, we need a break above the resistance zone 1.32750-1.33000. The upper trend line of resistance can create additional pressure in this zone. A break above would take us to the next potential resistance zone 1.33500-1.34000, the March high. If we continue up, our next target is February high in the zone 1.36000-1.36500. For the bearish option, we need continuation negative consolidation from yesterday. At 1.31500, our first support is the MA50 moving average, and if he gives us support, we look for the next one at 1.31000. A break below would bring us down to this year’s low at 1.30000.
USDRUB chart analysis
Today, USDRUB is consolidating in the range of 95,000-100,000 on the MA200 moving average. Yesterday, the Russian president stated that all countries that imposed sanctions on Russia will pay their obligations for the gas and other energy sources in Russian rubles. This strengthened the Russian ruble because it was in the range of 105,000-110,000 yesterday. We need a new bullish impulse for the bullish option that would raise the USDRUB pair above 110,000. Then we would get support in MA20 and MA50 moving averages. The next major target and resistance zone is at 120,000. We need a break below the MA200 moving average for the bearish option, and we are looking for support in the zone around 90,000. If bearish pressure continues, we are looking for the next potential support in the zone of around 80,000.
Market overview
The Swiss National Bank hold its interest rate unchanged on Thursday.
Central bank policymakers have decided to keep the reference and interest rates on demand deposits with the SNB at -0.75%.
The bank reiterated that it is ready to intervene in the foreign exchange market if necessary to counteract the growing pressure on the Swiss franc.
Russia’s invasion of Ukraine has led to a sharp increase in uncertainty worldwide.
Bank officials added that the SNB ensures price stability with its monetary policy and supports the Swiss economy.


