EURUSD, GBPUSD, AUDUSD mixed data from daily charts
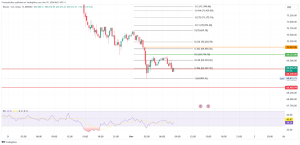
Looking at the daily time frame chart, we see that the Euro is still under pressure, and the EURUSD pair is currently testing the 20-day and 50-day moving average at 23.6% Fibonacci level at 1.18000. To continue on the bearish side, we need a further descent below with potential support at the previous low at 1.16640. Greater psychological support is down to 1.16000 low from November 2020. For a possible bullish trend, the couple needs to support moving averages. Further growth leads us to a new resistance test at 1.19000 at 38.2% Fibonacci levels. The further bullish continuation can take us to 50.0% Fibonacci level to 1.19650 and higher resistance in the 200-day moving average.
GBPUSD chart analysis
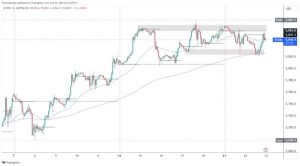
Looking at the chart on the daily time frame, we see that the pound is in a positive momentum today, climbing to the current 1,38700. Now we are looking to see if we manage to climb above 78.6% Fibonacci levels to 1.39000. Such a positive consolidation can take us back to 1.40000, and a new test of this psychological level. We need a negative consolidation below the moving averages for a possible bearish trend, which will steer the pair towards lower levels and perhaps make a new lower low. Our first significant support is at 23.6% Fibonacci level at 1,37300; after that, our next support is in the zone around 1,36900. Lower is the big support for the pair, and the obstacle of the bigger bearish trend is our area around 1.36000.
AUDUSD chart analysis
Looking at the graph of the daily time frame, we see that the pair encountered resistance at 0.74290, and after that, we have a price withdrawal at the current 0.73300. Our resistance coincided with a 23.6% Fibonacci level. Our potential support can be in the 20-day and 50-day moving average. If AUDUSD breaks that support, we can easily go to the lower psychological level at 0.70000 at 38.2% Fibonacci level. For the bullish scenario, we first need a positive consolidation that would raise the pair above 0.74300 and allow us to test the 0.75000 area again. Above this zone, the next obstacle awaits us in the form of a 200-day moving average at 0.76000.
Market overview
The unemployment rate in the UK fell in the three months to July, and the employment rate rose quarterly, data released on Tuesday by the Bureau of National Statistics showed.
The unemployment rate fell 0.3 percentage points from the previous quarter to 4.6 percent in the three months to July. That rate was in line with economists’ expectations.
At the same time, the employment rate rose 0.5 percentage points to 75.2 percent.
Average earnings, including the bonus, rose 8.3 percent year on year. Regular salaries that exclude bonuses advanced 6.8 percent between May and July.
Australian Reserve Bank Governor Philip Love said the conditions needed to raise the key cash rate will not be met before 2024. That market expectations for an early rate increase are not in place.
“Although interest rates could increase in other countries during this time period, our salaries and experience in inflation are quite different,” he added.
Given that the recovery has been delayed, it would be appropriate to postpone any consideration of further reductions in bond purchases until next year, Love said.
“By February, we will know more about how the economy reacts to easing restrictions than we will know in November,” he added.
At a meeting in September, the RBA continued to reduce property purchases. The board decided to buy government securities worth $ 4 billion a week and extended it for three months until mid-February.
Although the Delta outbreak delayed the economic recovery, it did not derail it, Love said. The economy is expected to grow again in the December quarter, and the recovery will continue until 2022.


