EURUSD, GBPUSD, AUDUSD without power for a larger movement
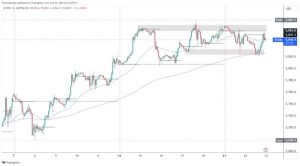
Again the EURUSD pair encounters resistance at the 1.13500 level. This resistance has been an obstacle for us since the beginning of December, and now we are close to the MA200 moving average. It is positive that we have support at 1.13000 with support for the MA20 and MA50 moving average. Now we need a new twist on the chart, and we can move on to the bullish side.
Bullish scenario:
- We need a new positive consolidation with the support of 1.13250 levels.
- We have support for MA20 and MA50 moving average in the zone around 1.13000.
- Now we have to break above 1.13500 if we want to continue.
- Our next resistance is at 1.14000, then the next at 1.14500.
Bearish scenario:
- We need to continue the negative consolidation and raise the price below 1.13000.
- In the zone around 1.12800, we find the lower support line, preventing a further decline in EURUSD.
- If this support does not last, we go further below 1.12500, and we are looking for the next support at 1.12250.
- Our maximum bearish target is lower low from November at 1.11850.
GBPUSD chart analysis
During the Asian trade, the British pound lost one part of the big gains from yesterday against the dollar. At yesterday’s meeting, the Bank of England unexpectedly decided to increase the reference interest rate by 0.15%, from 0.1% to 0.25%. That “rocketed” the pound against the repurchased dollar. By the way, the meeting of the US Federal Reserve showed last night that the US Federal Reserve is also moving towards tightening monetary policy and increasing the rate, mostly due to high inflation. However, the focus is on the already mentioned meeting of the Bank of England. The number of newly infected (from the “omicron” variant) in the UK has been at its peak since the beginning of the health crisis.
Bullish scenario:
- We need a new positive consolidation in zone 1.32500, where MA20 and MA50 moving averages are waiting for us.
- Then we turn to the bullish side and expect to see the pair first at 1.33500.
- In the zone around 1.33750, we come across the MA200 moving average, and here we need a new bullish impulse to break above and attack the zone 1.34000.
- Further growth of GBPUSD can lead us to a 1.35000 psychological zone.
Bearish scenario:
- We need continued negative consolidation and testing of 1,325,500 zones and MA20 and MA50 moving averages.
- Break below the descent money to 1.32000 support zone, so maybe we test the December low to 1.31600.
- A fall below this level will form a new minimum this year on the chart.
AUDUSD chart analysis
During the Asian trade, the Australian dollar strengthened against the American dollar in the first part of the Asian session. In the second part of the session, we see a withdrawal from a maximum of 0.722340. Excellent data from the Australian labor market, where the unemployment rate fell sharply, and the number of new jobs was much higher than expected, gave impetus to Aussie. The Australian dollar is now trading at 0.7150 US dollars, a slight decline of the Aussie by 0.36% since the beginning of trading tonight.
Bullish scenario:
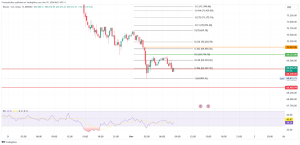
- With the support of MA and MA50 moving averages, we need a new positive consolidation that would be reoriented towards 38.2% Fibonacci level at 0.72050.
- In that zone, the MA200 moving average represents additional resistance. The last time we were above it was on November 9th.
- The break above climbs us to the next resistance at 50.0% Fibonacci level at 0.72720, and if AUDUSD continues, then we continue further to 61.8% Fibonacci level at 0.73380.
Bearish scenario:
- We need continued negative consolidation and withdrawal of AUSDUSD below the MA20 and MA50 moving averages.
- Then we test the support at 23.6% Fibonacci level at 0.71232, and the additional support on the chart is our lower trend line.
- A break below the support line would probably drop us down to a 0.70000 psychological support zone.


