EURUSD, GBPUSD Bearish Pressure is Still on Chart
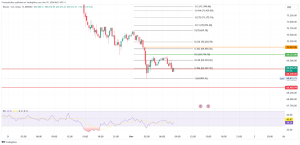
Looking at the EURUSD chart on the daily time frame, we see that around 1.16000 has taken a step towards the bearish side after consolidation, and we are now at the current 1.15500. Further negative pressure will soon lower the pair to a psychological level test at 1.15000. If the dollar continues to strengthen, we may see this pair at lower levels on the chart. For the bullish scenario, we need a new positive consolidation that will again raise the pair above 1.16500, where we will seek support in moving averages. The extra wind in the bullish trend would give a break above the upper resistance line. Only after that can we expect growth to the zone around 1.19000.
GBPUSD chart analysis
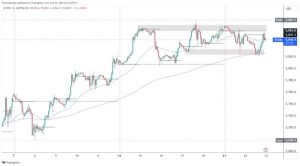
Looking at the GBPUSD chart on the daily time frame, we see that the pair is retreating from the resistance zone today at 1.36000-1.36500. If the pressure increases, we can expect to test the previous low again at 1.34000. While for the bullish scenario, we need a break again above 23.6% Fibonacci levels and first above the 20-day moving average. Our next upper resistance is 38.2% Fibonacci level at 1.37300. More broadly, we are in a falling channel. As long as we don’t make a break above the top line of the channel, we will be in a bearish trend.
 Market overview
German factory orders drop more than expected in August, Destatis data revealed on Wednesday. Factory orders fell 7.7 percent on a monthly basis, offsetting a revised growth of 4.9 percent in July.
Orders are projected to fall moderately by 2.1 percent. By allocating large orders, production orders decreased by 5.1 percent compared to July. Domestic orders fell 5.2 percent and foreign orders 9.5 percent in the month of August.
Growth in the UK construction sector slowed in September, with production rising for at least eight months due to supply chain problems and weaker demand, data released by IHS Markit showed on Wednesday.
The Chartered Institute of Procurement and Procurement Manager’s index fell unexpectedly to 52.6 in September from 55.2 in August. The expected level was 54.0.
The index signaled a slow rate of recovery in eight months. Nevertheless, a report reading above 50.0 indicates an extension.
All three broad categories of construction activity reported a decline in growth in September, with the largest slowdown in construction.
Retail sales in the eurozone rose less than expected in August, after falling in the previous month, preliminary Eurostat data showed today.
Retail sales rose 0.3 percent per month, after falling 2.6 percent in July, revised by 2.3 percent. Economists predicted growth of 0.8 percent.
On an annual basis, eurozone retail sales remained unchanged in August after growing by 3.1 percent in July. Economists predicted an increase of 0.4 percent.
Compared to the previous month, sales of non-food products increased by 1.8 percent, while sales of motor fuels fell by 0.1 percent. Sales of food, beverages, and tobacco decreased by 1.7 percent.
In the EU, retail sales increased by 0.3 percent compared to July, when they fell by 2.1 percent. Compared to last year’s same month, retail sales rose 1.1 percent after growing 3.8 percent in July.


 Market overview
