EURUSD, GBPUSD, NZDUSD, and AUDUSD Daily Chart View
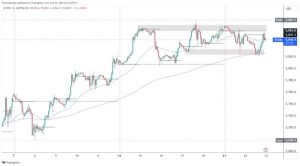
Looking at the EURUSD chart on the daily time frame, we see that the pair is still under a lot of pressure due to the strong dollar. We are still currently testing the support zone at 1.16600. But too much pressure can easily break that support and continue to the bearish side below 1.16500, after which we are looking for additional support at 1.16000. We need positive consolidation and a slight price increase towards the upper resistance line and 20-day and 50-day moving averages for the bullish scenario. A break above these resistances can give the wind in the back steam and trigger a stronger bullish trend. We would get additional support by moving the previous high to 1.19000 and a new approximation and testing of the 200-day moving average to 1.20000.
 GBPUSD chart analysis
Looking at the GBPUSD chart on the daily time frame, we see that the increasing pressure on the current support zone is at 1.36000. The price has currently broken through that zone and is now at 1,35720, and based on that, we can expect a descent to 1,33500 psychological levels. The GBPUSD pair is under pressure from all moving averages. Until we move above, we can expect the bearish trend to continue.
 NZDUSD chart analysis
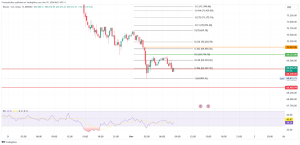
Looking at the NZDUSD chart on the daily time frame, we see that the vapor resistance was at the top line at 61.8% Fibonacci level at 0.71200. After that, we have a significant pullback to the current 0.69535. We foresee a possibility to visit the previous low to 0.68000. Positive at this level may be the earlier consolidation of the zone 0.69200-0.70615, which can direct the pair towards bullish targets. Technically, our first support is at 23.6% Fibonacci level at 0.69260.
AUDUSD chart analysis
Looking at the AUDUSD chart on the daily time frame, we see that the pair is still in a bearish trend after a decline of 23.6% Fibonacci level to 0.74270. Due to the strong dollar, the pair dropped to the current 0.72330, with a tendency to fall on 38.2% Fibonacci level to 0.70600. The moving averages amplify the additional bearish pressure from the upper side. So we can expect a further continuation to the bearish side. We need positive consolidation and growth above the 20-day and 50-day moving average for the bullish option to climb to the 200-day moving average and test the 0.75000 psychological level.
Market overview
In August, retail sales in Australia fell more slowly than expected, data from the Australian Bureau of Statistics showed on Tuesday.
Retail sales fell 1.7 percent monthly, but slower than the 2.7 percent drop announced in July. This is the third consecutive fall in retail sales. Economists predicted a monthly decline of 2.5 percent in August. Year on year, retail sales fell 0.7 percent, after falling 3.1 percent in July.
The Bank of Japan downgraded its short-term growth outlook by citing the impact of the coronavirus pandemic and increased its fiscal inflation forecast for 2021. The board also voted to keep the interest rate at -0.1 percent on current accounts held by financial institutions with the central bank.
President of the Federal Reserve St. Louis James Bullard commented that strong expansion will continue until 2022 and that it will take time to address labor supply issues.
Since the Fed is a little more aggressive, it would be best to ensure longer economic growth. There are two increases in interest rates in 2022. They require the balance sheet to start declining as soon as the purchase of bonds is completed.
The Fed shows a commitment to higher inflation but now risks too much success with too high inflation. At the high end of recent projections, inflation is expected to remain at 2.8% until next year. At this point, it would be a big shock to refuse the start of a reduction in bond purchases.

 GBPUSD chart analysis


