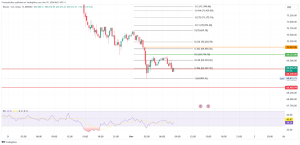
EURUSD, GBPUSD, NZDUSD Forecast for Nov 1, 2021
Friday was disastrous for the EURUSD pair; after reaching an October higher high at 1.16900, the pair made a sharp turn, and the value dropped to 1.15320. Today EURUSD found support at 1.15000, and the current gain climbed us to 1.15730.
Bullish scenario:
- EURUSD should break above the MA20 and MA50 moving averages.
- We need to go back to the previous resistance zone around 1.16500-1.16700.
- Our next resistance is the upper trend line at 1.17000, then the MA200 moving average at 1.17200.
- A breakthrough above boosts bullish optimism.
Bearish scenario:
- We need negative consolidation and new testing of the previous lower low at 1.15220.
- Our next lower support is 1.15000, then at 1.145000.
- There is still a lot of bearish pressure on the pair since May.
GBPUSD chart analysis
The GBPUSD pair is still under a lot of pressure. Friday’s decline continues from 1.38000 to the current 1.36760. The pressure is increased with moving averages from the upper side.
Bullish scenario:
- GBPUSD needs to find support at the current level, and we need a new positive consolidation.
- Further growth leads us again to the zone of moving averages around 1.38000.
- Our next resistance is the upper trend line from July.
Bearish scenario:
- Pair should continue the negative consolidation, and our next first support is at 1.36000.
- Then next at 1.35500, then 1.34100 October lower low.
- The broader picture tells us that we are still in the bearish trend and expect a further continuation to the lower levels on the chart.
NZDUSD chart analysis
The pair has been consolidating between 0.71300-0.72200 for the past two weeks. During last night’s Asian session, the NZD strengthened and climbed to the current 0.71950, testing 0.72000 level. For a more concrete continuation to the bullish side, we need a break above 0.72500.
Bullish scenario:
- Pair must stay above zone 0.71500 and, with positive consolidation, should make a breakthrough above 0.72500.
- As additional support, we have moving averages from below.
- Our first possible upper resistance is the trend line in the zone around 0.72500, and the bullish target is 0.73000 zones of movement in June.
Bearish scenario:
- We need a break below the 0.71500 support zone.
- Our first potential next support is at 0.71000 with the MA50 moving average, then 0.70500 with the MA200 moving average, and 0.70000 at the bottom trend line.
Market overview
Retail sales in Germany fell in September, Destatis data showed on Monday. Retail sales fell 2.5 percent month-on-month in September, reversing the growth of 1.2 percent in August. Economists forecast a monthly increase of 0.6 percent.
Year on year, retail sales fell 0.7 percent, up from 0.9 percent in the previous month. Sales are forecast to grow 1.8 percent. Compared to February 2020, before the crisis, retail sales in September were 3.7 percent higher.
Growth in manufacturing activity in the UK improved in October for the first time in five months. Still, production grew slower due to increasing supply chain disruption, staff shortages, and falling foreign demand; final IHS Markit data showed on Monday.
The Chartered Institute of Procurement & Supply Production’s final manager’s index rose to 57.8 in October from 57.1 in September.
Growth has slowed by slowing production growth. Due to delays in the supply chain and shortages of raw materials, production has been growing at the slowest pace in the last eight months.
The research showed that the overall degree of positive mood dropped to an eight-month minimum. Continued optimism among producers with signs of stabilizing demand growth spurred stronger job creation in October.


