EURUSD, GBPUSD, NZDUSD Grow While the Dollar Weakens
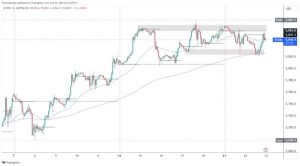
Looking at the EURUSD chart, we see that the pair gained MA and MA50 support by breaking above them, and we have now climbed to 1.16500 to test the previous low of 23 August. If we manage to overcome this level, then we can expect to see EURUSD up in the MA200 moving average zone and on the upper trend line in the area around 1.17500. A further break above us could lead to around 1.19000, the site of previous highs and resistance to a further bullish trend. For the bearish option, we need a negative consolidation in the zone 1.16500-1.17000 and then a withdrawal to previous lows from the beginning of October.
Our first support is in area 1.15750-1.16000, and if we continue further down, our next support is in zone 1.15000-1.15250. October is bullish for the Euro; for now, based on the picture on the chart, such a scenario will probably remain until the end of the month.
 GBPUSD chart analysis
Looking at the GBPUSD chart, we see that the pair made during the Asian session a break above the MA200 moving average at 38.2% Fibonacci level at 1.37300, making a further bullish solid momentum, pushing the price up to 50.0% Fibonacci level at 1.38300. Suppose GBPUSD makes the next break above this zone of Fibonacci resistance. In that case, our next target and resistance are at 61.8% Fibonacci level at 1,39300, and a little above that awaits our psychological level at 1,40000. Since the beginning of October, the pound has been in a bullish trend. It will remain so until the end of the month.
For the bearish trend, we need a pullback below 38.2% Fibonacci levels and the MA200 moving average, among our support is at 1.37000, then we come across the MA20 moving average in the 1.36750 zone. The break below us leads to a 23.6% Fibonacci level at 1.36000 and MA50 moving average as additional support to this level.
 NZDUSD chart analysis
Looking at the NZDUSD chart, we see that the NZD has dominated the dollar throughout October. This is especially since the New Zealand Reserve Bank raised interest rates from a historical low from 0.25% to 0.50%. Soon pair should test the previous high from the beginning of September at 0.71650. The graph shows that NZDUSD has good support with all moving averages from the bottom. A break was made above 61.8% Fibonacci level at 0.71240. This can be a good sign that we will remain on the bullish side in the coming period.
Our first upper next resistance and target is 78.6% Fibonacci level on 0.72100 on June’s high. For the bearish scenario, we need a pull below the 50.0% Fibonacci level and below the trend line. Further withdrawal brings us down to 38.2% Fibonacci level to 0.70000, where we are waiting for all moving averages that at that level can prevent the continuation of the bearish trend and open a new momentum towards the bullish continuation.
 Market overview
There is no logic for the European Central Bank (ECB) to raise rates from now until the end of 2022. This is because inflation in the eurozone is expected to fall below the ECB’s target of 2%, said the governor of the Bank of France, Francois Villeroy de Galhau, on Tuesday.
He also eased concerns that problems in China’s Evergrande Group, which is facing a liquidity crisis, could have a wider impact, saying: “There will be no contagion outside of China. This is a serious problem for the Chinese authorities.”
Villeroy, a member of the ECB’s policy-making board, told France Info radio that headline inflation in the eurozone in 19 countries should return below 2% by the end of next year.
Last week, ECB President Christine Lagarde said that the central bank still sees the rise in inflation in Europe as temporary and that there are still no signs that the jump this year has led to a jump in salaries.

 GBPUSD chart analysis
 NZDUSD chart analysis
 Market overview
