EURUSD, GBPUSD without strength for more concrete growth
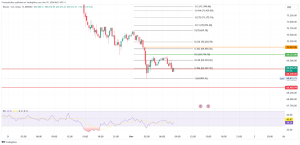
Looking at the daily time frame chart, we see that the EURUSD pair found current support on the 20-day and 50-day moving averages with a 23.6% Fibonacci level at 1.18000. If support continues with positive consolidation continuing on the bullish side, the next resistance awaits us at 38.2% Fibonacci level at 1.18940, in place of the previous two highs that failed to continue on the bullish side. The main target of this potential bullish pullback is our 200-day moving average at 1.20000 and 50.0% Fibonacci level. For the bearish scenario, we expect the price to fall below the current support zone to go down to the previous low of 1.16640, and before that, we could find potential support at 1.175000.
GBPUSD chart analysis
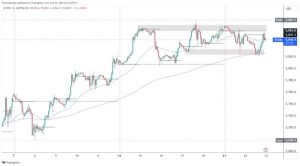
Looking at the chart on the daily time frame, we are in a bullish trend after yesterday’s turbulent and indecisive day today. The GBPUSD pair found support at 50.0% Fibonacci level at 1.37900 with the additional support of the 20-day and 50-day moving average. Now we need a break above the 200-day moving average and 61.8% Fibonacci level at 1.18360. The continuation above us leads to the next resistance at 1.39000. In contrast, for the bearish trend, we need a price withdrawal below 50.0% Fibonacci level. After that withdrawal, the first following support is at 38.2% Fibonacci level at 1.37500.
Market overview
British-made price inflation has accelerated more than expected to its highest level since 2011, data from the Bureau of National Statistics showed on Wednesday.
Product price inflation rose to 5.9 percent in August from 5.1 percent in July. The rate was expected to rise moderately to 5.4 percent.
This was the highest rate since November 2011. Oil products had the highest annual growth rate of 50.4 percent. Transport equipment made the largest contribution to the growth of 2.07 percentage points to the yearly rate.
Monthly, the production inflation rate was 0.7 percent in August, compared to 0.8 percent in July. The expected rate was 0.4 percent.
The UK’s consumer price inflation accelerated at a record pace in August, exceeding expectations, preliminary data from the National Statistics Office showed today.
The consumer price index rose 3.2 percent year on year after rising 2.0 percent in July. Economists predicted inflation of 2.9 percent.
The ONS said that the 1.2 percentage point increase was the largest ever recorded in a 12-month series of interest rates that began in January 1997. The sudden change is likely to be temporary, the agency added.
Compared to the previous month, the CPI rose 0.7 percent in August, which was faster than economists had predicted a 0.5 percent increase.
Core inflation, excluding energy, food, alcohol, and tobacco prices, accelerated sharply to 3.1 percent from 1.8 percent in July. Economists predicted inflation of 2.9 percent.
In July, Eurostat reported on Wednesday that industrial production in the eurozone rose after falling for two consecutive months.
Industrial production rose 1.5 percent a month in July, reversing a 0.1 percent decline in June and a 1.1 percent decline in May. This was also better than the forecast of + 0.6 percent.
All components of production except energy recorded monthly growth in July.
Production of durable consumer goods rises by 3.5 percent and production of capital goods by 2.7 percent. Production of durable consumer goods rose 0.6 percent, while energy production fell 0.6 percent.
On an annual basis, industrial production growth weakened to 7.7 percent in July from 10.1 percent in June. Growth was projected to climb 6.3 percent.
Production in the EU27 grew by 1.4 percent in July per month, so the annual growth reached 8.3 percent.


