EURUSD, USDRUB, GBPUSD chart analysis
EURUSD chart analysis
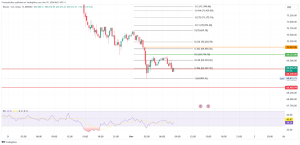
Pair EURUSD continues its bearish trend from March 17 after climbing to 1.11360. Now the pair is testing potential support at 1.10000. Increased pressure is given by the MA20 and MA50 moving averages, and additional confirmation for the continuation of the bearish trend is the break below the March trend support line. The next lower support is in the zone around 1.09000, last week’s low. If this support does not last, the next one is at 1.08000, the March minimum. For the bearish option, we need a EURUSD jump above 1.12000. An additional potential resistance at that level is the MA200 moving average. European Central Bank President Christine Lagarde said yesterday that the eurozone’s monetary policy will not keep pace with the policy of the US Federal Reserve because the military conflict in Europe and the repercussions of sanctions against Russia have very different consequences for the US and Europe. On the other hand, Jerome Powell, the chairman of the US Federal Reserve, yesterday called for extremely fast steps in the direction of tightening monetary policy if inflation is not brought under control, currently at the highest level in the last 40 years. That pushed the yields on US government bonds, which continued to grow, and the dollar hit back with a strong blow from yesterday.
USDRUB chart analysis
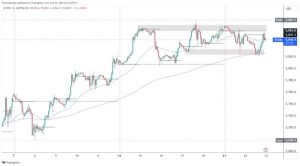
The USDRUB pair is consolidating around 100,000 levels this week. We are looking at support in the MA200 moving average, and if we see a break above, then we can expect a continuation of the pull to lower levels. If there is a break below the MA200 moving average, then we can expect the money to go down to 90,000 first, then look for the next support at 80,000. We need to break above the upper resistance line for the bullish option. Then we expect growth first to 120,000, and after that, all moving averages move to the bullish side. The following bullish positive consolidation can take us up to 134,000 levels, and depending on the strength of the bullish impulse, and we might even test our maximum at 154,350.
GBPUSD chart analysis
The pound strengthened today against the dollar index, and the GBPUSD pair made a break above 1.32000; we are currently at 1.32200. The MA20 and MA50 moving averages steer the pair towards the bullish side, and our next target is the 1.32740 February support zone, now resistance. If the pair continues on the bullish side, the main zone of greater resistance awaits us 1.33540-1.34000. For the bearish option, we need a new negative consolidation and a withdrawal of GBPUSD first below 1.32000. Then from further bearish pressure, the next potential support is at 1.31000, with support in MA50 moving averages. A maximum pullback on this time frame we can expect up to 1.30000 level.
Market overview
British news
The UK budget deficit narrowed in February compared to last year. Still, the deficit was the second-largest in February since it began to be recorded in 1993, the Office for National Statistics said on Tuesday.
Net public sector borrowing, excluding public sector banks, was £ 13.1 billion in February, down £ 2.4 billion from February.
Coronavirus support funds combined with declining cash incomes and falling GDP are cited as the main reasons for the increase in net debt.
European news
After falling in the previous month, construction output in the eurozone rose in January, driven by construction activity.
Construction production rose 3.9 percent on a monthly basis in January, after falling 1.5 percent in December. In November, construction production increased by 0.1 percent.
The highest monthly production growth in construction was recorded in Poland, Germany, and Romania among the member states. The worst declines were in Hungary, Belgium, the Netherlands and Italy.


