The chart review for March 11
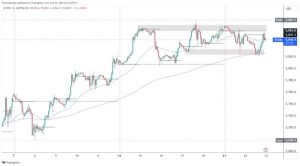
EURUSD chart analysis
Pair EURUSD finds current support at 1.09500 after the news was released that there are some improvements in the conversation between Russia and Ukraine. No concrete news has been published, only positive changes. EURUSD makes a new jump to 1.10440. For a more specific bullish scenario, we need a break above 1.11000 in order to continue our further recovery. Our first major goal is to climb to the March resistance zone at 1.12000. For the bearish option, we need a pull below 1.10000 and a new test of the previous low at 1.09500. If a break occurs below, the next potential support is at 1.09000, then the March minimum at 1.08000.
GBPUSD chart analysis
The pound fell to 1.30500 this morning, the lowest level in a year and a half. After that, we have a deviation from the minimum and growth above 1.31000. For further continuation, we need a break above 1.31500 because then we get additional support in the MA20 and MA50 moving average. Our next resistance is 1.32000 zones. The additional resistance on that level is our MA200 moving average. At 1.32750, we come to the place on the chart of the February former support, which is now our resistance. We need a negative consolidation for the bearish option that would result in a new withdrawal below 1.31000. After that, we test the previous low again at 1.30500, and the break could bring us down to the psychological level at 1.30000.
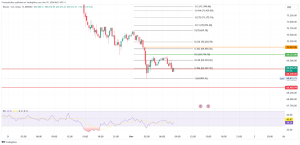
USDRUB chart analysis
Pair is in bearish consolidation after reaching its all-time high of 154.2000. We now see the pair retreat, forming a new lower high as part of this consolidation. Our current support is at 114.6970, and our additional potential support is the MA200 moving average. If this bearish consolidation continues, our target is 100,0000 psychological level, and the potential upper resistance in the zone 130,000-135,0000. For the bullish option, we need a jump of USDRUB above 140.0000 in order to try to jeopardize the historical high to 154.2000. If that happens, a break above is possible, as well as the formation of a new historical maximum in the coming period.
AUDUSD chart analysis
Since the beginning of the Asian session, AUDUSD has been in retreat with 0.73700. Pair dropped to 0.73000 to the bottom trend line. We are slowly retreating below the MA20 and MA50 moving averages and are now testing the MA200 as potential support. A break below the support line and below 0.73000 would increase bearish pressure. The potential first support then is 0.72500 level. And if it does not last, the next support awaits us at 0.72000, then this week’s minimum at 0.71500.
Market overview
The UK economy has recovered faster than expected at the beginning of the year after the impact of the Omicron variant eased, data released by the Office for National Statistics on Friday revealed.
Gross domestic product rose 0.8% in January, down from 0.2% in December. Economists forecast a marginal growth of 0.2% for January.
GDP was 0.8% above pre-crown levels. In the three months to January, GDP grew by 1.1% compared to the previous three months.
All sectors expanded in January, with services contributing the most to growth. Production of services recorded an expansion of 0.8%, supported by wholesale and retail trade.
Russia’s invasion of Ukraine has raised the risk of a recession in the UK by exacerbating already acute inflationary pressures on consumers and businesses and disrupting the supply of critical products in many sectors of the economy, stated Suren Thiru, head of the British Chamber of Commerce’s economy.


