Understanding USDCAD and USDCNH: How to Trade at 1.35440
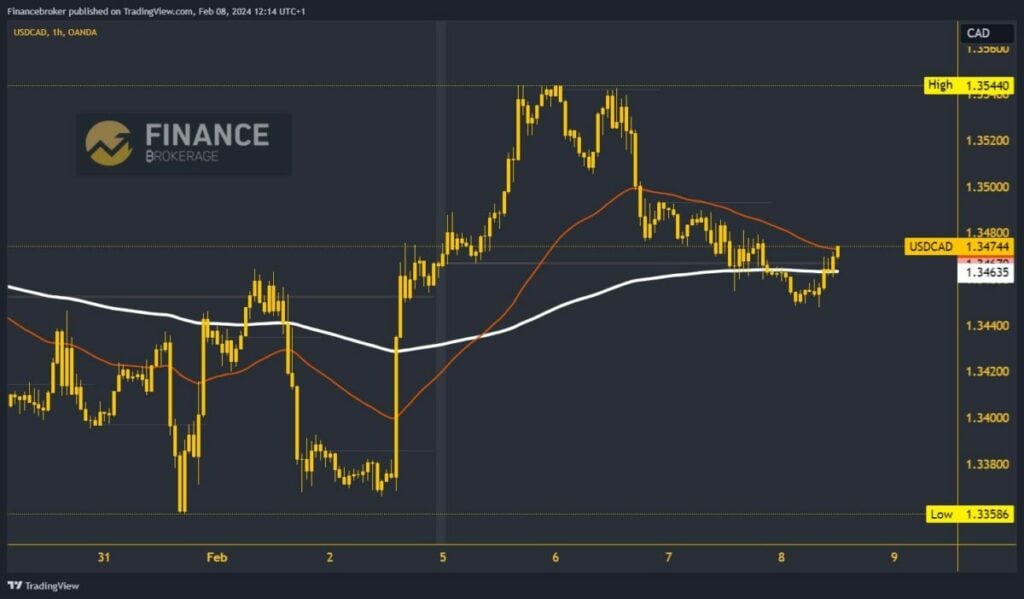
- This week, USDCAD peaked on Monday evening at the 1.35440 level.
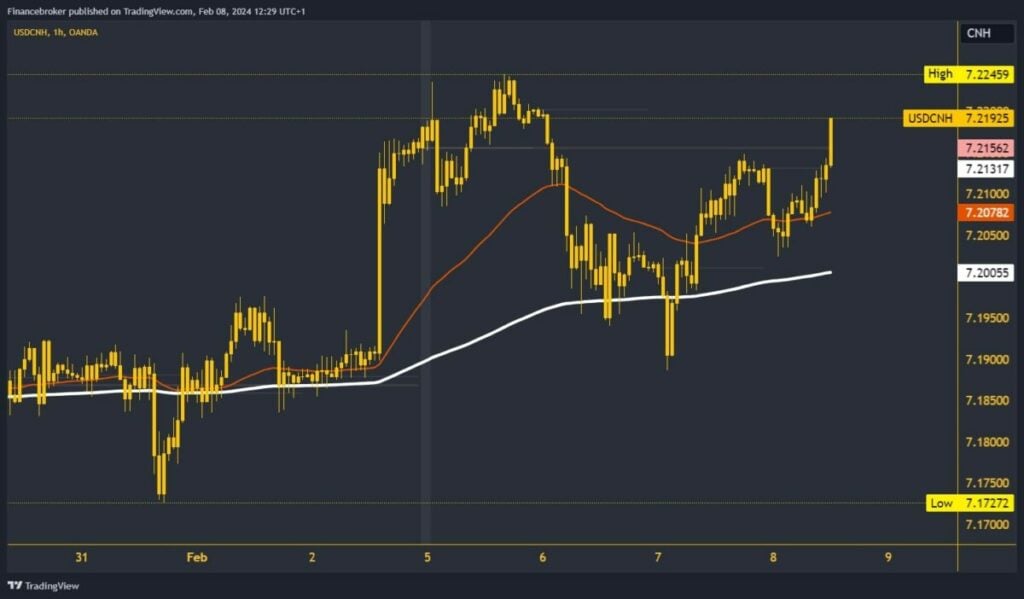
- USDCNH retreated to the 7.18875 support level on Wednesday.
USDCAD chart analysis
This week, USDCAD peaked on Monday evening at the 1.35440 level. On Tuesday, during the Asian session, a pullback began, which brought the yen down to the 1.35000 level by the end of the day. Yesterday the decline continued throughout the day to 1.34480 levels this morning.
The pair stops the fall there and starts recovery and growth to the 1.34730 level, climbing above today’s market opening price.
The dollar has an opportunity to break through the bearish formation with a bullish impulse and start a concrete recovery. Potential higher targets are 1.34800 and 1.34900 levels. We have additional support in this zone in the EMA200 moving average. Also positive for USDCAD is the move above the weekly open price.
USDCNH chart analysis
USDCNH retreated to the 7.18875 support level on Wednesday. Bearish pressure brought us below the EMA200 the day before, influencing us to form this low. We received support there, initiated a bullish consolidation, and returned above the EMA200 and 7.20000 levels.
Last night, we climbed up to the 7.21500 level and stopped briefly in that zone. During the previous Asian session, we saw a pullback to the 7.20500 level.
With new support, we quickly initiate a bullish consolidation, and rise to the current 7.21650. Potential higher targets are 7.22000 and 7.22500 levels. We need a pullback to the 7.2000 level and the EMA200 moving average for a bearish option.
There, we would be under pressure to seek support. The inability to hold above leads us to fall below and form a new low. Potential lower targets are 7.19500 and 7.19000 levels.
