USDCAD and USDCNH: USDCAD at April high 1.37000 level
- Yesterday, USDCAD jumped to 1.37030 levels with a strong bullish impulse.
- A strong bullish impulse pushed USDCNH to the 7.26424 level yesterday.
USDCAD chart analysis
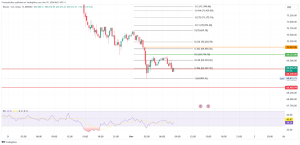
Yesterday, USDCAD jumped to 1.37030 levels with a strong bullish impulse. Positive news on US inflation pushed this pair to a new monthly high. During the Asian trading session, the pair moved in the 1.36750-1.37000 range. Now, we are again waiting for the US session and a new impulse that could show us the future direction of the USDCAD movement. A break above 1.37000 would take us to a new weekly high and thus only confirm that we remain in a bullish trend.
Potential higher targets are 1.37200 and 1.37400 levels. We need a pullback below the support at the 1.36750 level for a bearish option. With that, we go to a new daily low and get confirmation of the growing bearish momentum. Potential lower targets are 1.36600 and 1.36400 levels. Additional support for USDCAD in the zone around 1.36400 is the EMA50 moving average.
USDCNH chart analysis
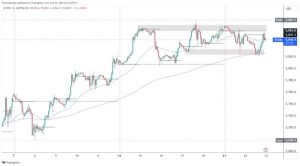
A strong bullish impulse pushed USDCNH to the 7.26424 level yesterday. So we formed a new weekly high, and we stopped there. During this morning’s Asian session, the pair pulled back sharply to 7.25200 levels. The reason for this is the news about Chinese inflation. Inflation decreased compared to the previous month, which briefly strengthened the Chinese currency. The pair successfully stopped here and started a new positive consolidation up to the 7.25800 level.
It is possible that we will see USDCNH return to the zone of yesterday’s high. Potential higher targets are 7.26000 and 7.26200 levels. For a bearish option, we need a negative consolidation and a retest of support at 7.25200. There, we come across the EMA50 moving average, which could slow or stop this decline. Potential lower targets are 7.25000 and 7.24800 levels.


