USDCAD and USDCNH: USDCNH fell to 7.23476 level yesterday
- Yesterday, we watched USDCAD pull back to support at the 1.36321 level.
- A new seven-day low USDCNH was formed at the 7.23476 level.
USDCAD chart analysis
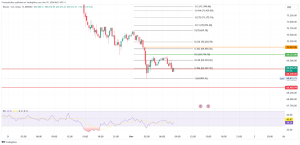
Yesterday, we watched USDCAD pull back to support at the 1.36321 level. Down there, we received the required support and a bullish consolidation was initiated, which has continued today. This pushed the USDCAD above the 1.37000 level. For now, we stop there and fall to 1.36800, sliding below the EMA200 moving average. The pair is under pressure to drop even lower and search for a new support level.
Potential lower targets are 1.36700 and 1.36600 levels. We are testing the weekly open price in the 1.36700 zone, and it would be good if we managed to stay above that level. We need a positive consolidation and a return to the zone of 1.37000 levels for a bullish option. This is where we attack this week’s high, and we will have the opportunity to climb to a new one with a new impulse. Potential higher targets are 1.37100 and 1.37200 levels.
USDCNH chart analysis
A new seven-day low USDCNH was formed at the 7.23476 level. After that, the pair stops there and initiates a positive consolidation up to the 7.25675 level. This is where we hit the EMA200 moving average and failed to move above it. From that level, we see a pullback again, this time to the 7.24500 level. If the pressure on USCNH continues, a drop to a new low is inevitable.
Potential lower targets are 7.24000 and 7.23500 levels. We need a positive consolidation and a return up to the EMA200 and 7.25550 levels for a bullish option. Then, we must stay up there before continuing with a new impulse to the bullish side. Potential higher targets are 7.26000 and 7.26500 levels.


