USDCAD Bullish Consolidation: EMA200 & 1.34800 Level
- This week’s USDCAD movement is in the zone around the EMA200 moving average.
- On Monday, during the Asian session, USDCNH rises to a new February high at 7.22554 level.
USDCAD chart analysis
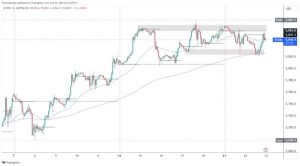
This week’s USDCAD movement is in the zone around the EMA200 moving average. Yesterday, we tried to start a bullish consolidation above the EMA200 but stopped at the 1.34800 level. This was followed by a drop below to support at the 1.34300 level. The movement was in the 1.34400-1.34600 range during the previous trading session. We expect a calm chart until the US session, when US inflation news will be released.
If the news is positive for the dollar, a break above the EMA200 will follow, and the formation of this week’s new high and target is the 1.35000 level. We need a pullback below 1.34400 today’s support level for a bearish option. The new daily low increases pressure on USDCAD to continue searching for lower support. Potential lower targets are 1.34200 and 1.34000 levels.
USDCNH chart analysis
On Monday, during the Asian session, USDCNH rises to a new February high at 7.22554 level. After that, we watched a pullback to the 7.21280 support level. We manage to stay above that level, then, we recover up to 7.22300, and form a lower high there. During today’s Asian session, the pair is in bearish consolidation up to 7.12250 levels. With this move, we are testing yesterday’s support zone.
New pressure could bring us down to EMA200 in the zone around 7.21000 levels. For a bullish option, USDCNH should return above 7.22000, thereby confirming the previous bottom’s formation. After that, we expect to see a move above this morning’s high and attack this week’s high. Potential higher targets are 7.22500 and 7.23000 levels.


