USDCHF and USDJPY: USDJPY at new multi-year high of 153,30
- We saw a strong bullish impulse on the USDCHF chart on Wednesday following the US inflation announcement.
- This week, we have seen a clear bullish trend in the USDJPY.
USDCHF chart analysis
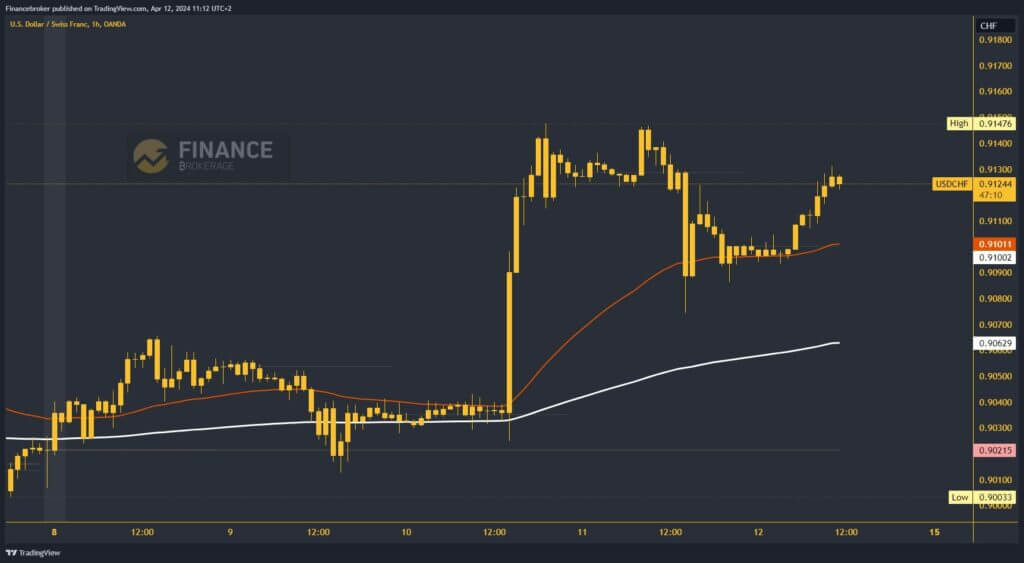
We saw a strong bullish impulse on the USDCHF chart on Wednesday following the US inflation announcement. Positive data for the dollar pushed this pair from 0.90300 up to 0.91476 levels. After that, we moved in that zone for some time, only to see a pullback to new support at the 0.80800 level yesterday. During the Asian trading session, the pair moves above 0.90900 and consolidates there.
Then, with a new bullish impulse, we start with a positive consolidation and grow to the 0.91300 level. We can expect further continuation to the bullish side. Potential higher targets are 0.91400 and 0.91500 levels. We need a negative consolidation and pullback to this morning’s support at 0.90900 for a bearish option. Falling below that level would increase the negative pressure on USDCHF, and we could expect to see a new daily low. Potential lower targets are 0.90800 and 0.90700 levels.
USDJPY chart analysis
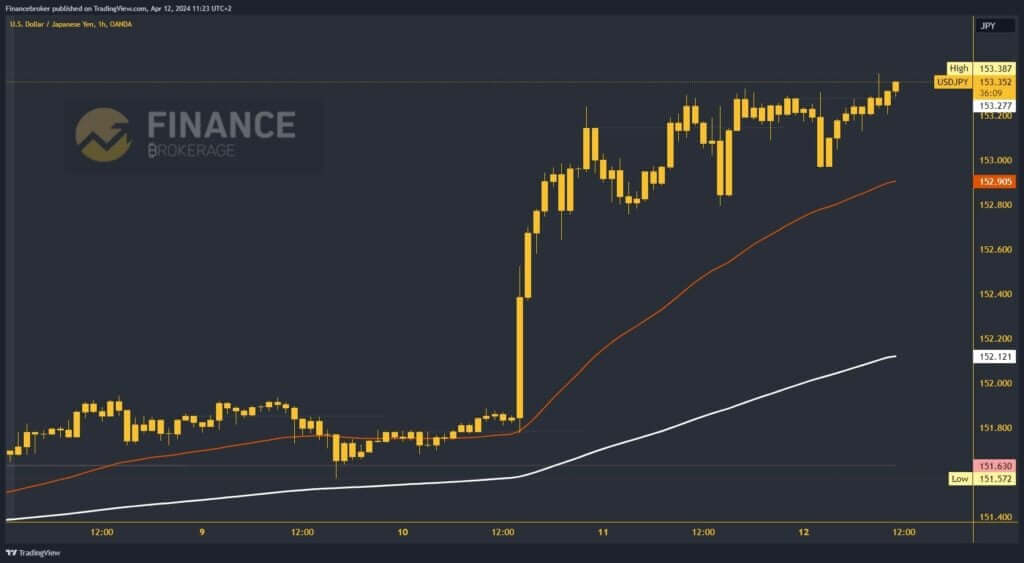
This week, we have seen a clear bullish trend in the USDJPY. On Wednesday, we broke above the 152.00 level and climbed above the 153.00 level. We spent yesterday consolidating in the 152.80-153.20 range. During this morning’s Asian trading session, we are again climbing above 153.20 and rising to a new high at the 153.38 level. We are now at 153.33 and could see new momentum above for a new weekly high.
Potential higher targets are 153.40 and 153.60 levels. For a bearish option, we need a return below the 153.00 level. In that zone, we encounter the EMA50 moving average. Falling below it will increase the bearish pressure to continue on the bearish side. Potential lower targets are 152.80 and 152.60 levels. EMA200 remains low at 152.20 level.


