USDCHF and USDJPY: USDJPY is retreating below the 149.00
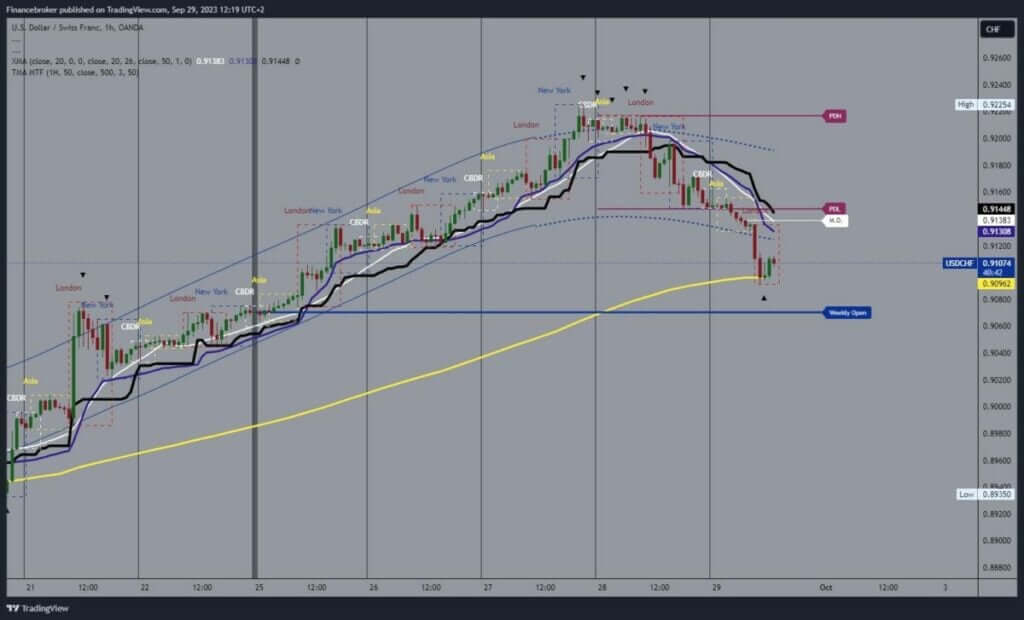
- On Thursday, we saw the formation of a new six-month high at the 0.92254 level.
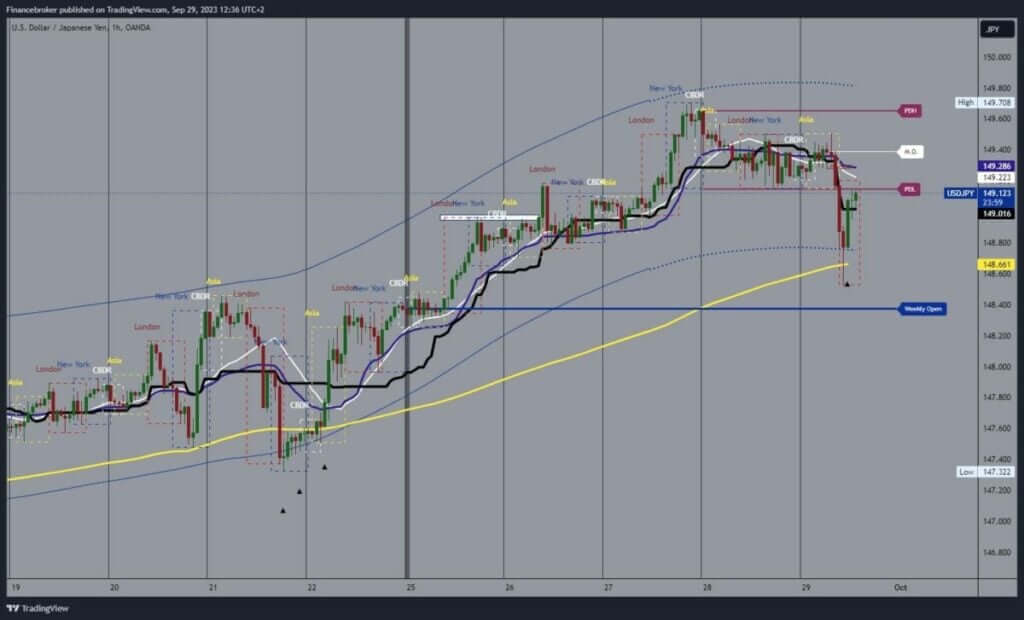
- During the week, USDJPY was in a bullish trend up to 149.70 level.
USDCHF chart analysis
On Thursday, we saw the formation of a new six-month high at the 0.92254 level. After that, the pair began to retreat during yesterday’s day, and the decline continued today to the 0.90960 level. At this level, we encounter the EMA50 moving average, which could provide some support and stop the decline. A break below would send USDCHF down to test the price from this week’s market open at the 0.90700 level.
We need EMA50 moving average support and positive consolidation for a bullish option to push USDCHF. After that, we could see a continuation to the bullish side. Potential higher targets are 0.91000 and 0.91200 levels.
USDJPY chart analysis
During the week, USDJPY was in a bullish trend up to 149.70 level. In that zone, we encounter resistance, and the pair begins to pull back to the 149.10 support level. In the previous Asian session, we tried to start a recovery, but we stopped at the 149.50 level. After that, we see a bearish consolidation and pullback to the 148.50 level. In this zone, we encounter the EMA50 moving average and expect to receive its support. Potential lower targets are 148.25 and 148.00 levels.
We need a positive consolidation and a return above the 149.50 level for a bullish option. Then, we need to keep up there so that we can start further recovery with a new impulse. Potential higher targets are 149.75 and 150.00 levels.

