USDCHF and USDJPY: USDJPY made a new high at 146.40
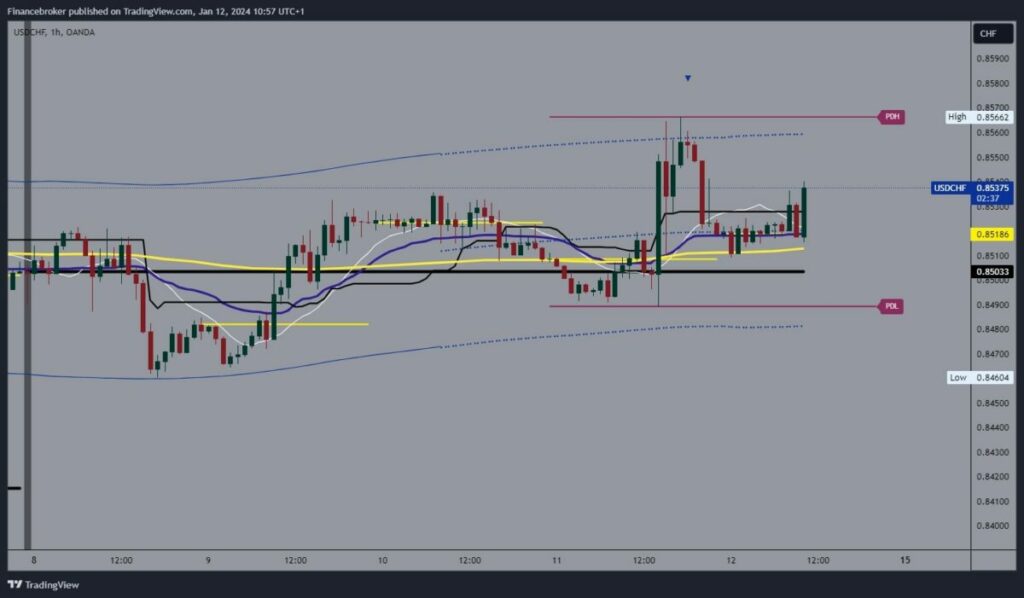
- This week, we have seen a mild bullish USDCHF consolidation in the 0.84600-0.85600 range.
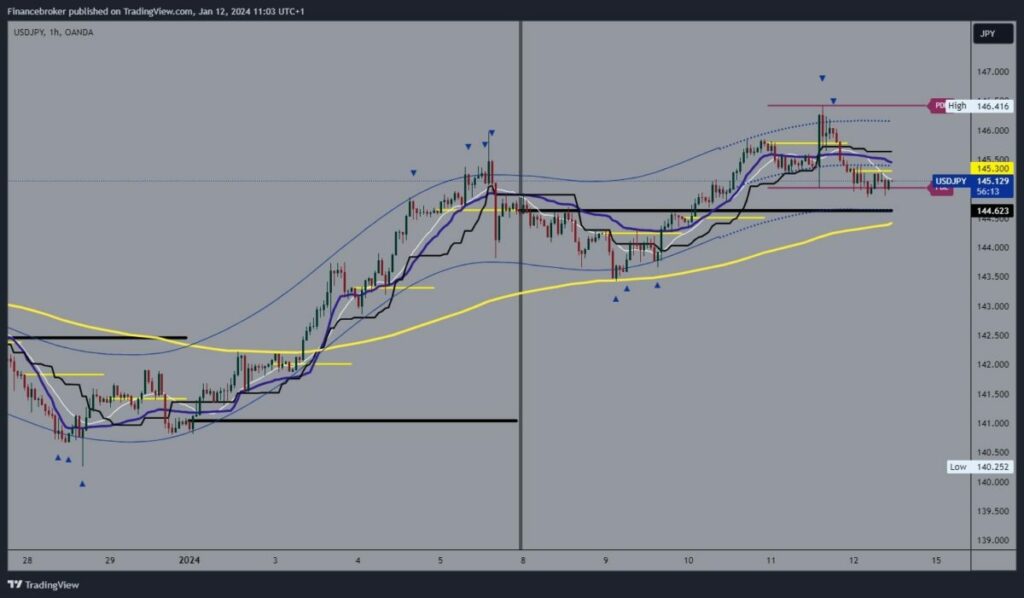
- USDJPY climbed to the 146.41 level this week and formed a three-week high.
USDCHF chart analysis
This week, we have seen a mild bullish USDCHF consolidation in the 0.84600-0.85600 range. On Monday, we saw a pullback to support at the 0.84600 level. After gaining support, the pair initiated a bullish consolidation to 0.85662 levels yesterday. We stop there and initiate a pullback to the 0.85100 level. Here, we come across the EMA50 moving average, which stops the decline and provides support, keeping us above.
During the Asian session, the pair moved above the 0.85200 level, and now we see a break above and growth to the 0.85380 level. If this consolidation continues, we could retest the previous resistance level by the end of the year. Potential higher targets are the 0.85600 and 0.85700 levels. We need a pullback below the EMA50 and the 0.85000 level for a bearish option. There, we would get close to yesterday’s low at 0.84900. Potential lower targets are 0.84800 and 0.84700 levels.
USDJPY chart analysis
USDJPY climbed to the 146.41 level this week and formed a three-week high. We stop there and start a pullback below the 146.00 level. During the previous Asian trading session, the pair fell below 145.50 and went down to the 145.00 level. The dollar is now under pressure to begin a pullback to 144.50, where we encounter the EMA50 moving average.
This week, we have already successfully tested the EMA50 once and received the requested support. Potential higher targets are 145.50 and 146.00 levels. We need a drop below the EMA50 and 144.50 levels for a bearish option. In this way, we would switch to the bearish side and be able to start a further pullback. Potential entry targets are 144.00 and 143.50 levels.
